Thursday, May 20, 2010 (would like mark this guy today)
已有 31846 次阅读 2010-05-20 17:49http://carlfutia.blogspot.com/
Thursday, May 20, 2010
What's next ??

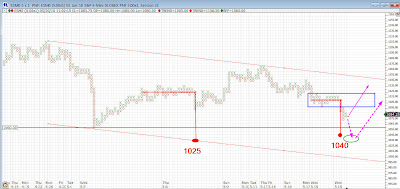
Here is a five point box, one box reversal point and figure chart showing 24 hour e-mini trading.
The drop from last week's high of 1174 has been much, much bigger than I anticipated. What's next?
So far today the low end of my range estimate at 1075 has held. But the rally off of this morning's low has been feeble. That could change and strength above the 1100 level, the lower edge of the trading range outlined by the blue rectangle, would be very bullish. It would mean that the market is headed for 1200 over the next few weeks.
Should the ES drop back to 1075 before moving visibly above 1100 I think the 1056 low will be broken. The downside should be limited to the 1025-1040 area (green oval) as indicated by the two point and figure counts I have drawn on the chart. I think a drop below 1056 would turn into a terminal shakeout and be followed by big rally. Such a shakeout would also define a George Lindsay, three peaks formation with tops in October, January, and April. I'll have more to say about the implications of the three peaks if 1056 is broken.
After the smoke clears I think all the downside action since the April 26 top will eventually be seen as a normal bull market corrective phase. I think we shall see new bull market highs within a couple of months.


发表评论 评论 (0 个评论)