When the second round of quantitative easing was announced late last year, Federal Reserve Chairman Bernanke indicated that one of the primary objectives of the program was to inflate risk assets such as stocks. In that respect, the program has been an unqualified success, as the S&P 500 index has now gained more than 26% during the course of 5 months.
However, as a result, the index P/E ratio has increased to more than 18, and the most reliable forecasting models based upon current earnings and dividends indicate that expected 10-year annual returns are now slightly more than 3%, regardless of whether or not the economy is in fact experiencing a sustained recovery.
Thus, from a purely investment perspective, stocks are priced to deliver very poor results during the coming decade. Additionally, the short-term outlook now favors the development of a potentially violent correction.
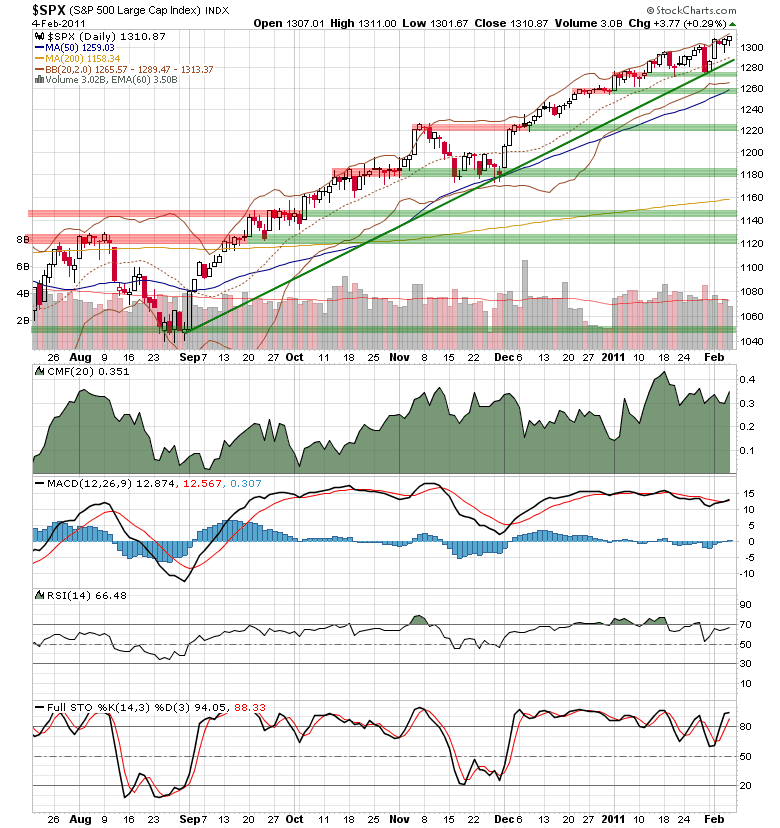
On Friday, the S&P 500 index moved up to another marginal new high for the rally from September, pushing an overextended advance to yet another extreme.
click to enlarge images

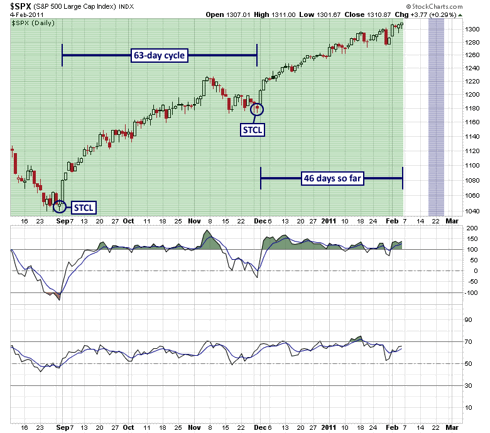
The current short-term cycle from the end of November is now 46 trading days old, and it has yet to enter the final decline of the beta phase, suggesting that it will likely terminate in the 55 to 60 day range. The previous cycle had a duration of 63 trading days. These are moves of extremely long duration, well above their historical average of about 39 trading days.
Of course, to truly put the overextended nature of the move in perspective, it must be viewed in the proper context afforded by the big picture. Below is a monthly chart of the S&P 500 since the current secular bear market began in 2000.
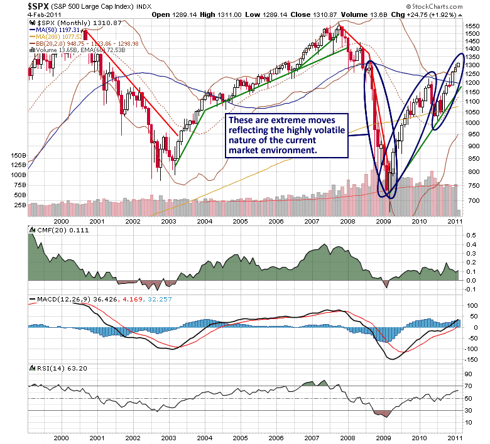
Notice how the character of market behavior changed materially with the crash in late 2008. Since then, stocks have been moving effectively straight up or straight down. This type of volatile price action is typical for this stage of the bear market and indicates that we are still several years away from the terminal phase of the secular decline.
Returning to the short-term view, our Cyclical Trend Score (CTS) has been negatively diverging from price action since October, and the CTS is currently holding slightly above its December low.
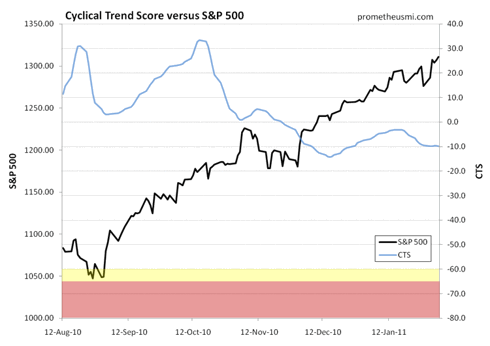
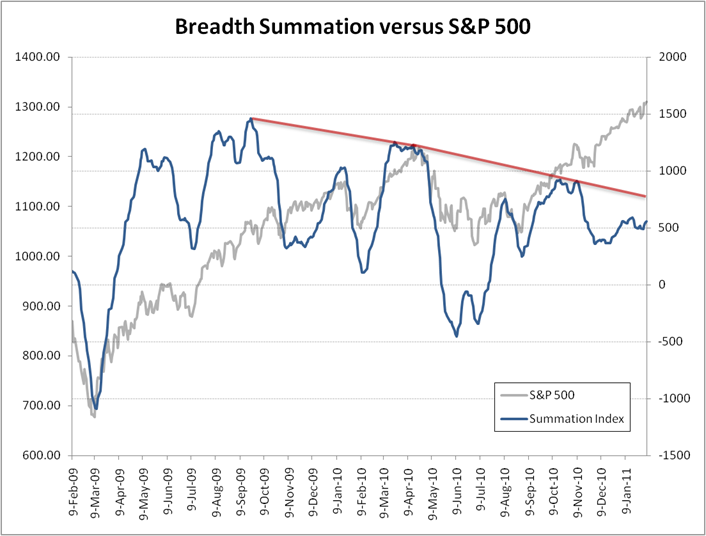
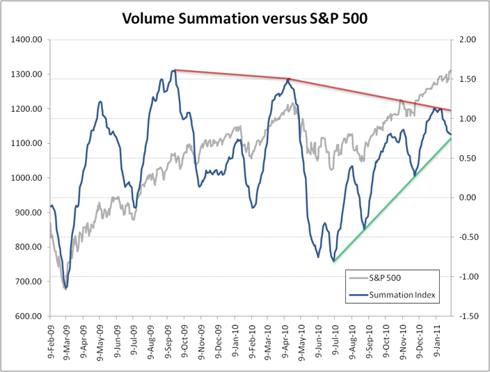
Although the CTS is not a near-term timing indicator, this negative divergence reflects a gradual deterioration in underlying strength. The developing weakness is also manifested by broad market internals such as breadth and volume, as both continue to negatively diverge from price behavior.

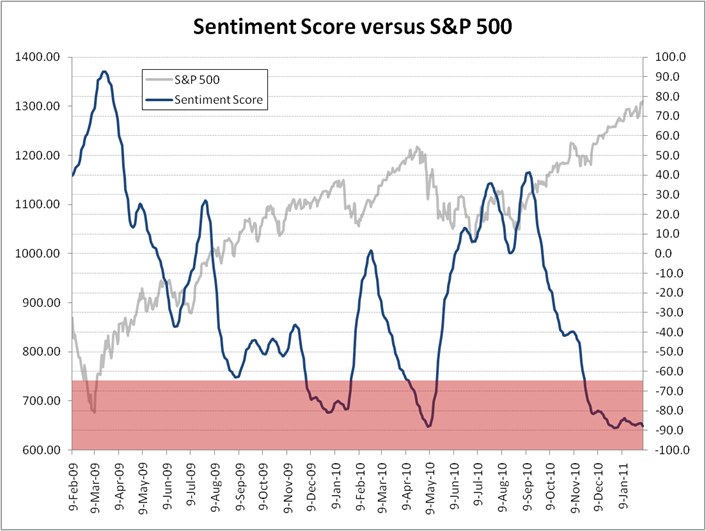
Finally, our Sentiment Score continues to hold near the lowest level since late 2007, reflecting irrationally excessive bullishness that leaves the market vulnerable to an abrupt decline.

Of course, overextended rallies of this type have a tendency to continue making marginal new highs until, at some point, an unexpected catalyst sets in motion the inevitable correction, which will likely be fast and furious, wiping out several weeks of gains in a matter of sessions.
From a big picture perspective, the character of the next correction should provide a great deal of clarity with respect to long-term direction. A relatively weak retracement followed by a return to recent long-term highs would predict a subsequent breakout and continuation of the cyclical bull market, while a powerful, sustained downtrend would suggest the development of a long-term top. |


 发表于 2011-2-7 13:04
|
发表于 2011-2-7 13:04
| 

 发表于 2011-2-7 18:43
|
发表于 2011-2-7 18:43
|