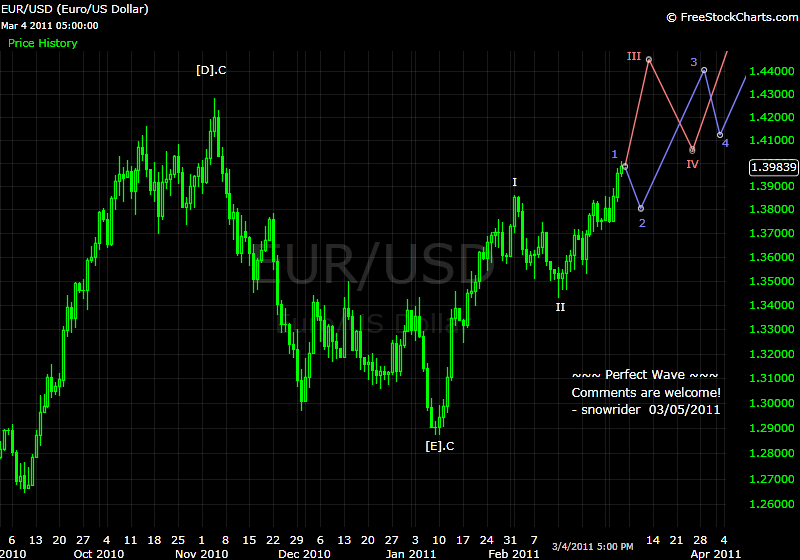
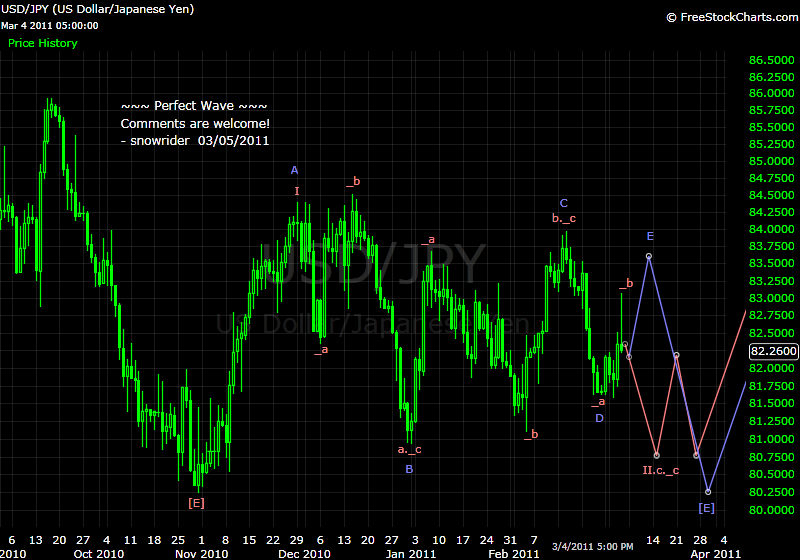
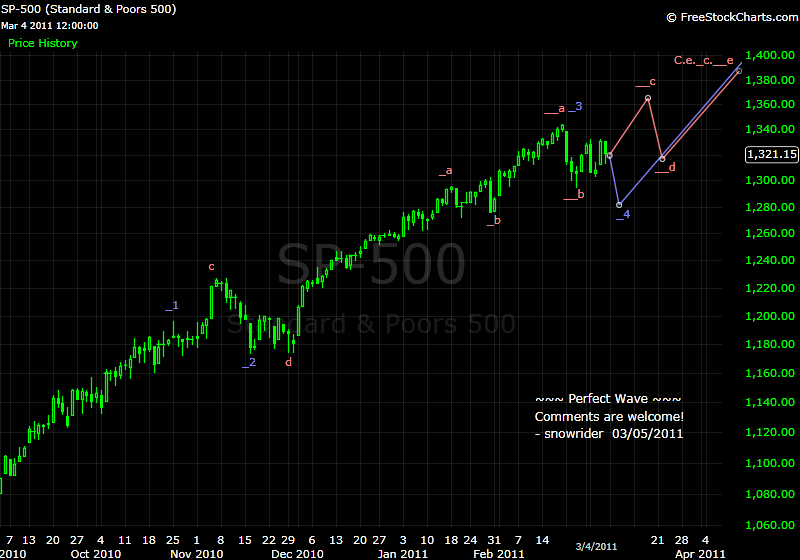
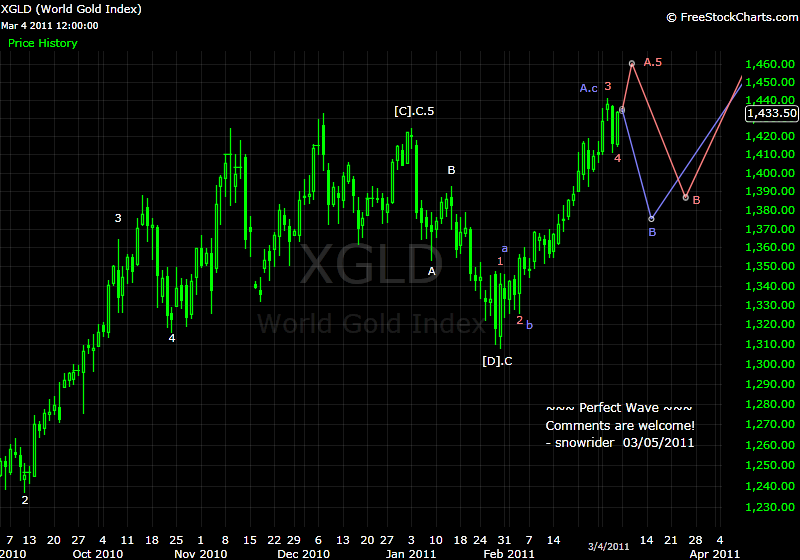
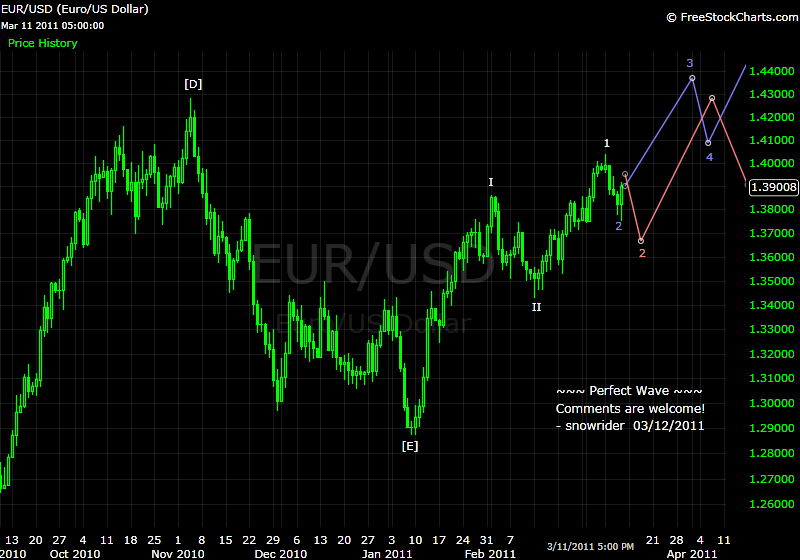
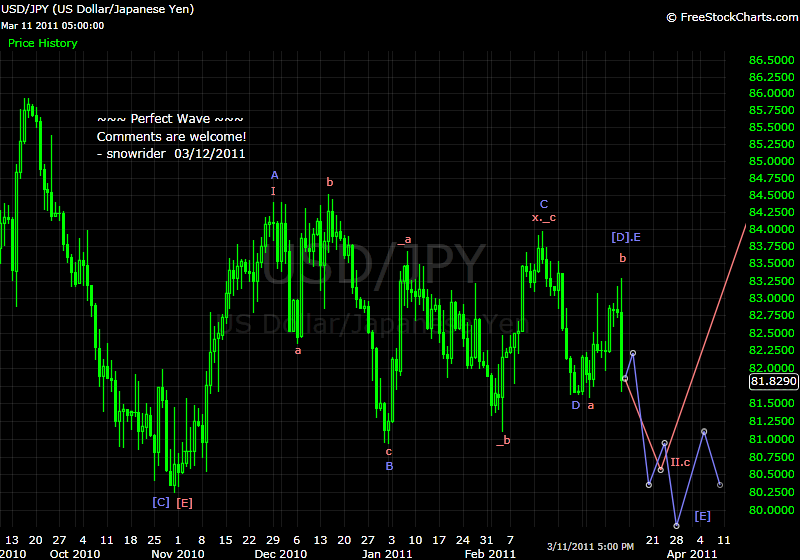
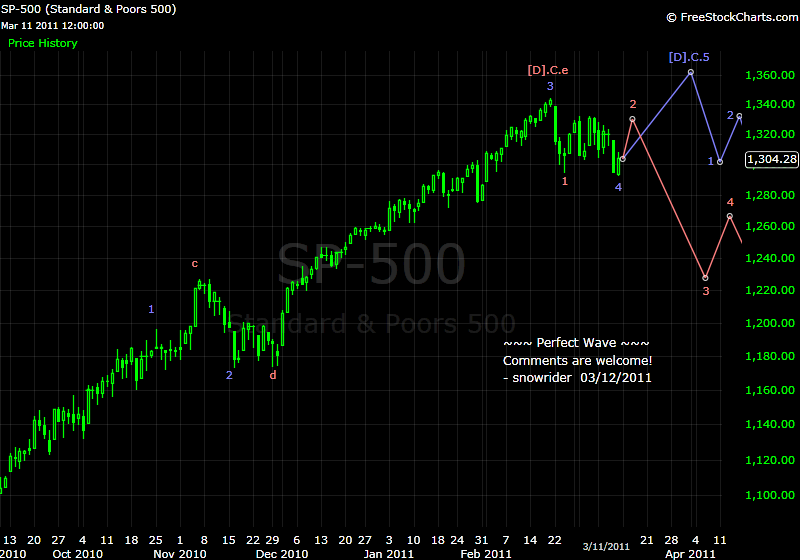
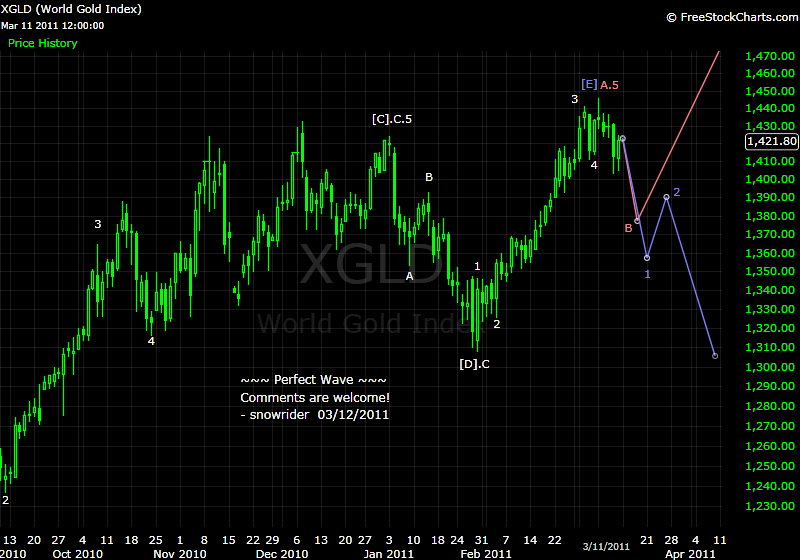
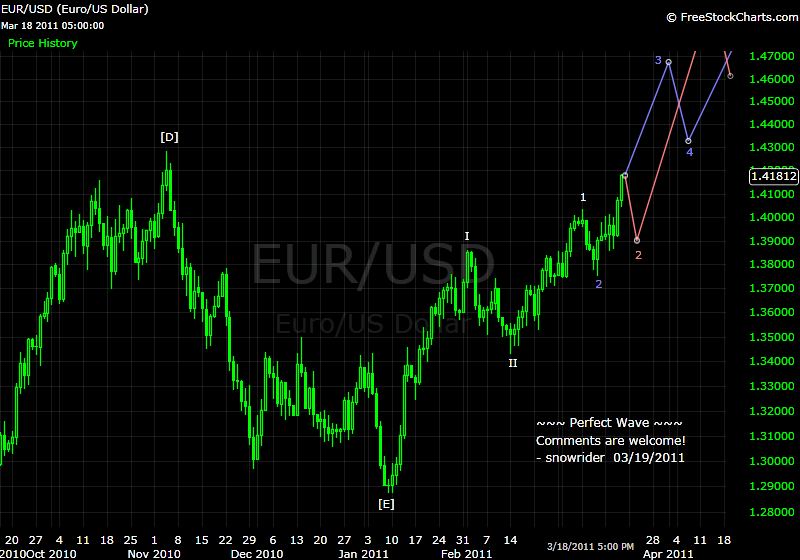
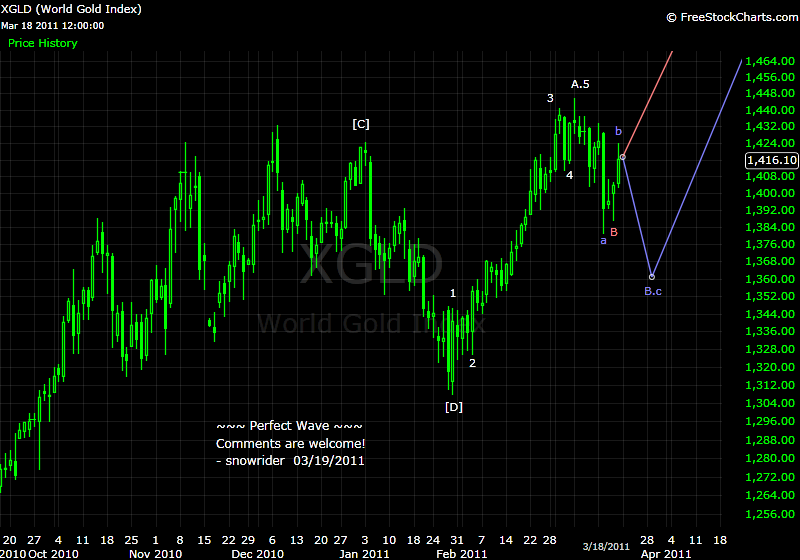
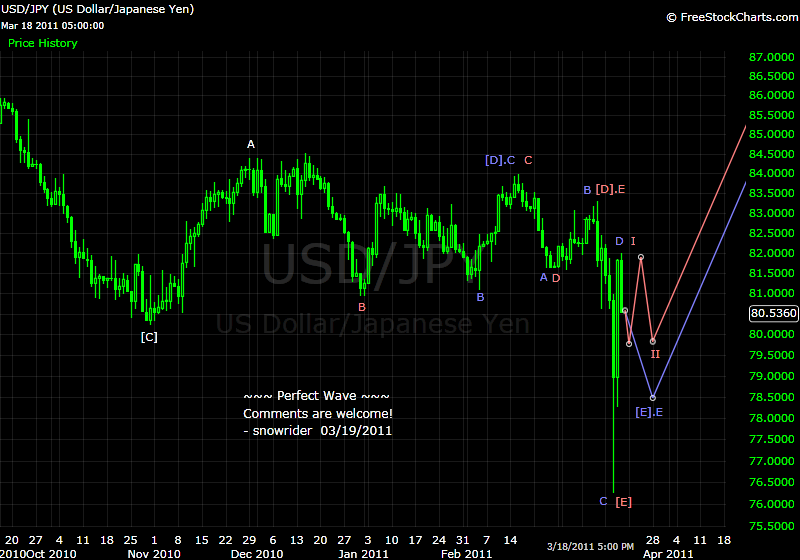
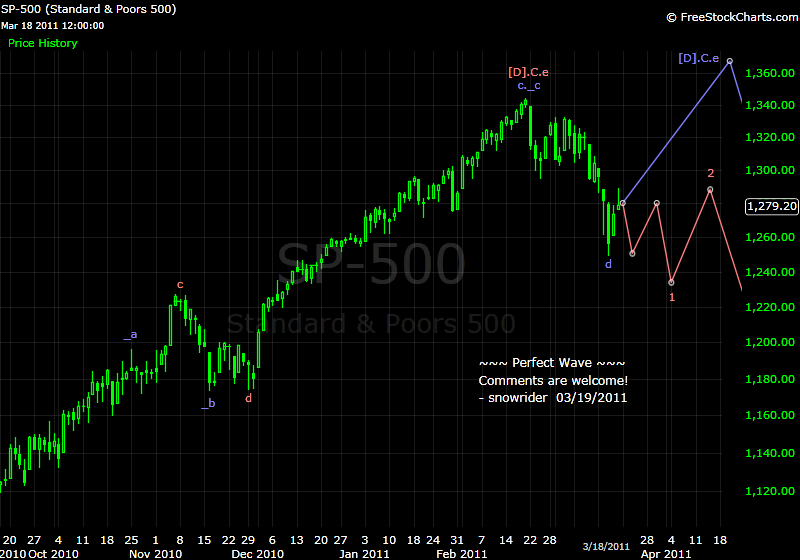
I post my wave count every weekend when I am less busy, so probably that's why you see the wave counts change from time to time. For each chart, I draw two possible counts - which means two possible market movements in my opinion.
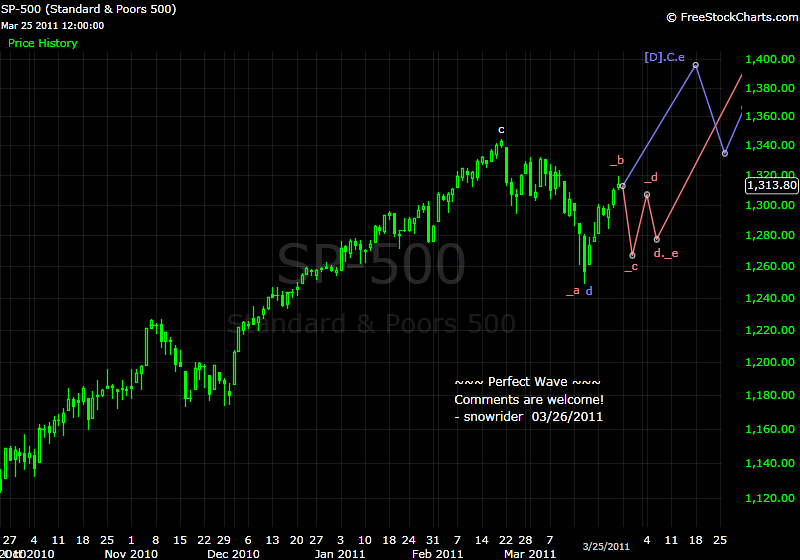
For example, about SP, on 03/12 my counts were either wave-4 was ending (blue line) or a big collapse (wave-3) was going to happen (red line). On 03/19, since a sharp downward movement occurred which voided the wave-4 scenario (because the size of wave), I corrected my counts to either a higher degree of correction (wave-d) was completed (blue line) or the 03/12's red line scenario was still valid.
You can find that some of my wave counts point to the same direction without ambiguity but some don't. |


 发表于 2011-3-6 16:06
|
发表于 2011-3-6 16:06
|