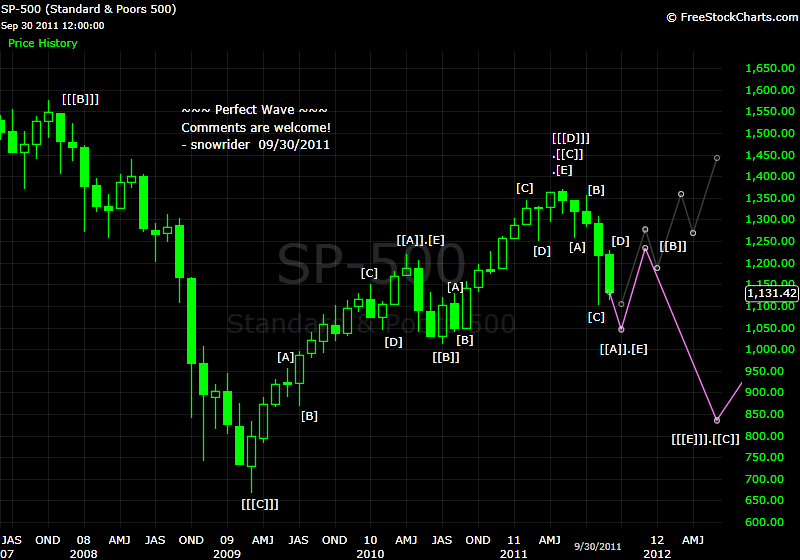
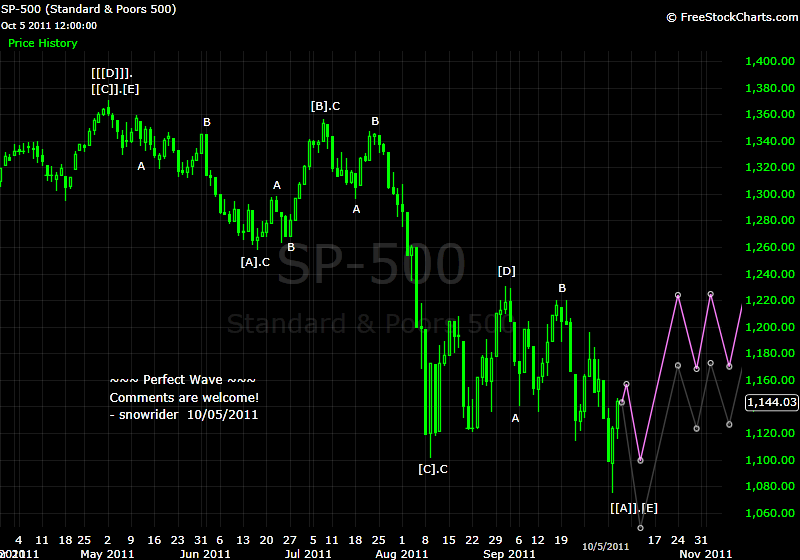
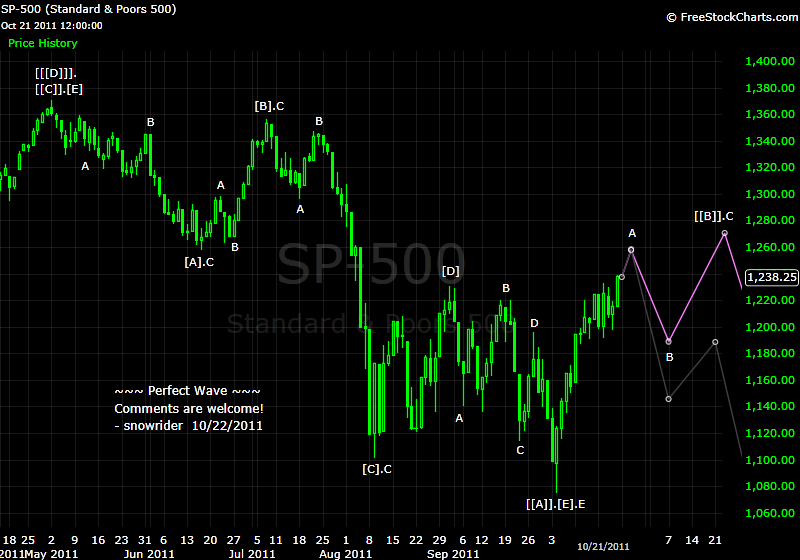
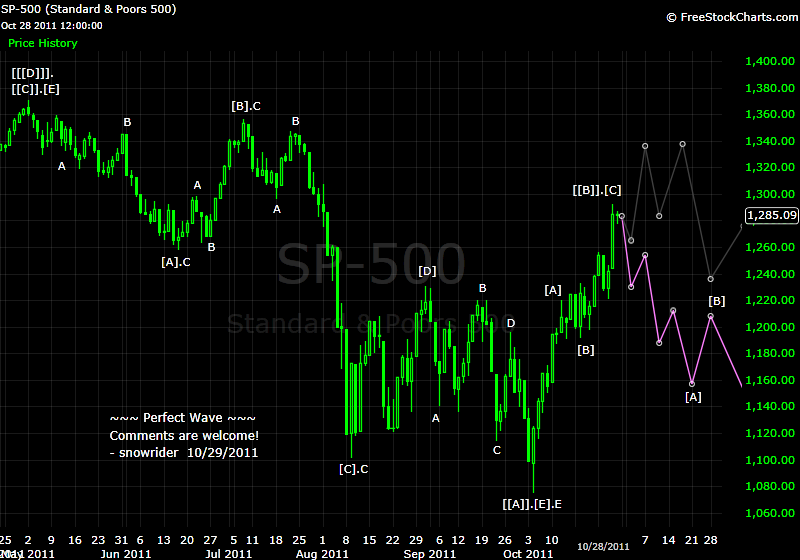
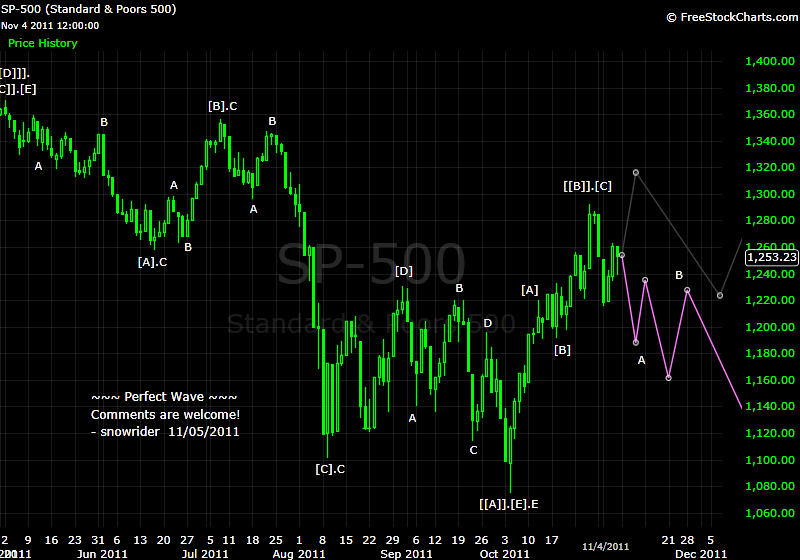
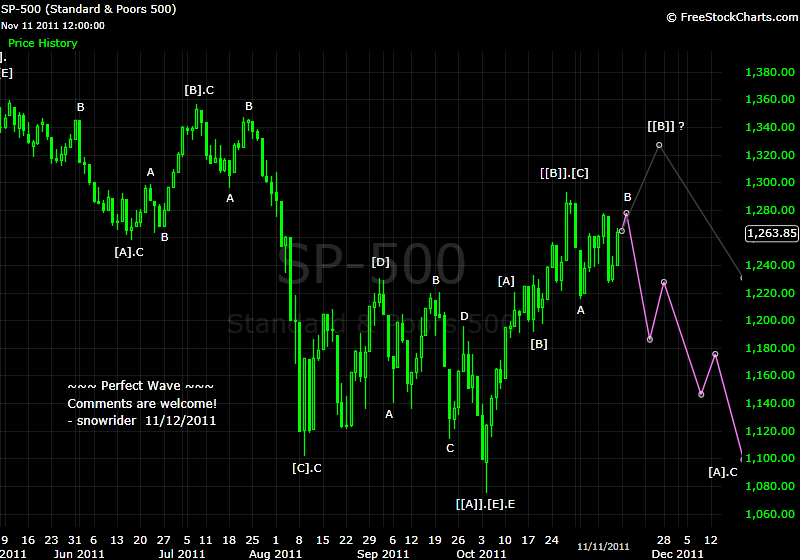
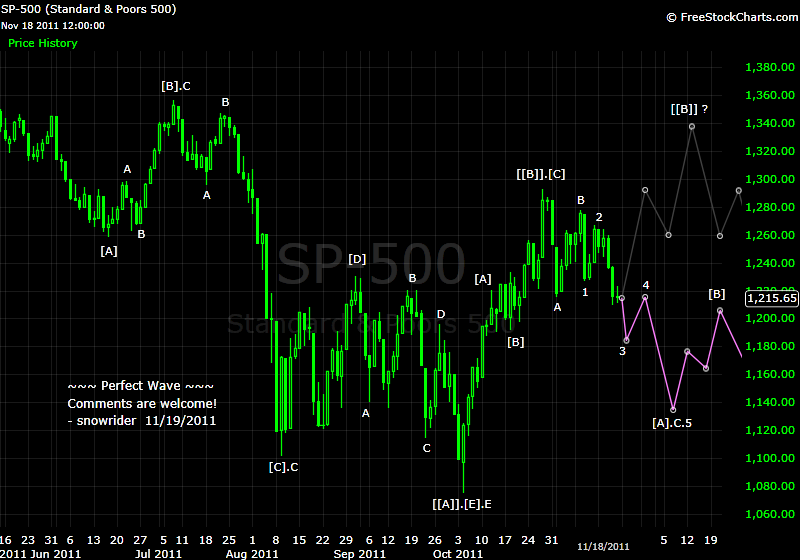
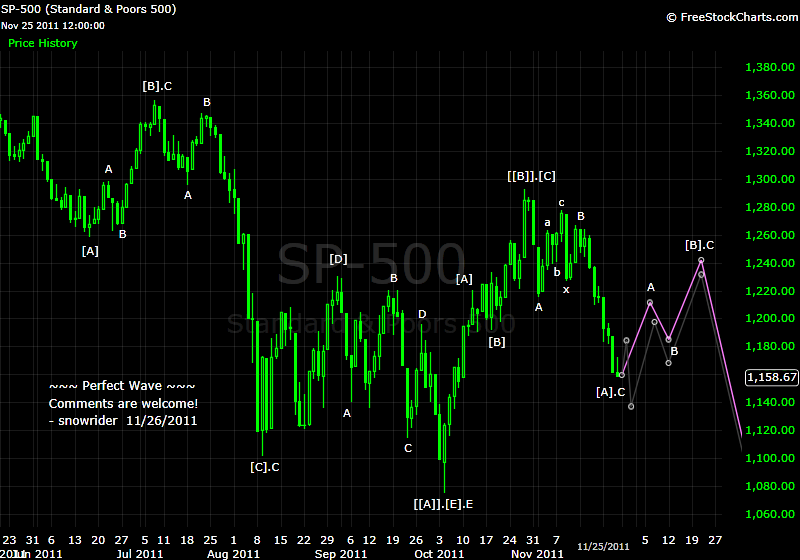
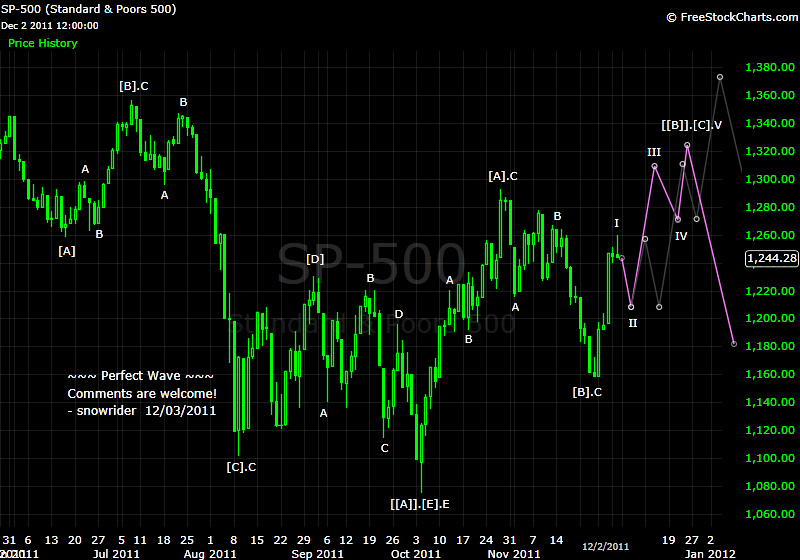
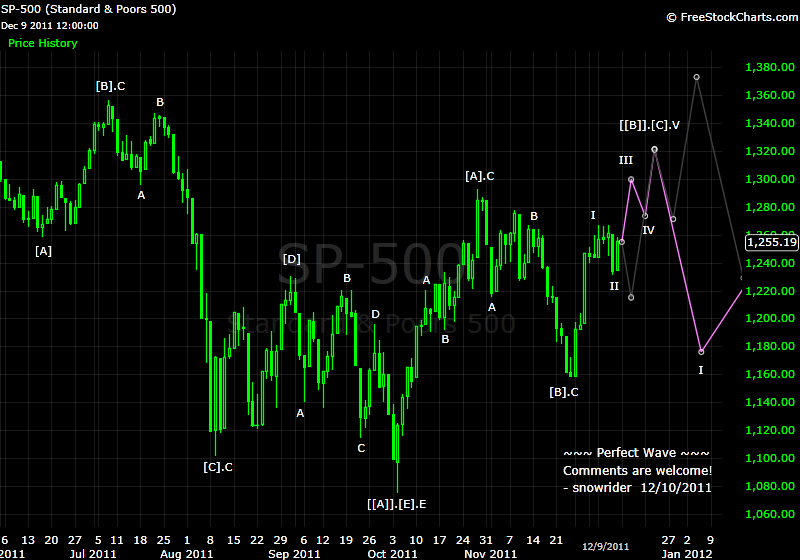
SPX 月线图上紫线走势和俺的想法接近,下破1100之后,反弹拉起.
谢谢雪骑的分享!
棋王 发表于 2011-10-1 17:20
wave 理论有没有引进成交量这个概念?
人性都是贪婪又胆小的。。3波5波,其中的某一波没有忽悠到足够的人进来(量不够)或者忽悠进来的人太多,会影响到下一波的时间和高度吧?
举个例子。比如股票spring & thrust, 或者突破,大庄家突破了,但是发现没有什么人进入(量不够),庄家这个时候想:ctm的,突破拉高没有忽悠到什么钱进来,再向上会被他人short高顶,股票自己全扛着岂不亏大了,只好快速炸盘让和他在同一条阵线的人出去不了,想short的人也来不及。 如果是在大牛市,无量突破,虽然发现没有什么人进入(量不够),但庄家这个时候想:ctm的,就让那帮人short,我继续拉得更高,挤死他们,这样sqeeze得股票sky高(琢磨着nflx就是这样,单看这两年标准大牛屎啊)。
...

SPX 月线图上紫线走势和俺的想法接近,下破1100之后,反弹拉起.
谢谢雪骑的分享!
棋王 发表于 2011-10-1 17:20

...量在价先,,, 反过来,价格对量有什么影响? 比如上涨速度快或者价格高对后来的量怎么影响呢?价格高,有时不愿买,有时chase high (比如认为价值发现或者回归)。wave里面有些什么判断?
时间和空间,小散伤疤好需要一段时间,有range market,这个时间在wave 理论里面怎么处理?
是不是一般就到9波? ES 1min-chart 最牛的时候我就看到9波(其中5波上涨)。。量在7,9波时慢慢枯萎了?其它的比如和fib retracement的关系怎么样? nflx 大牛时不只9波吧?
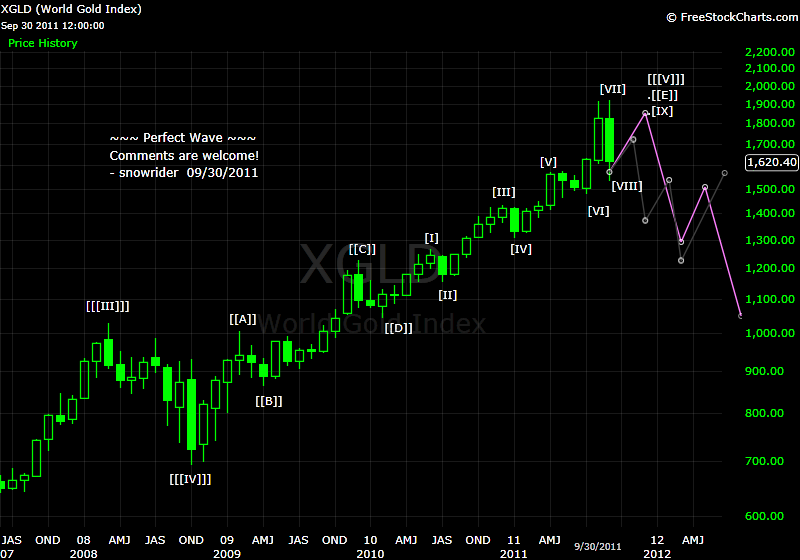
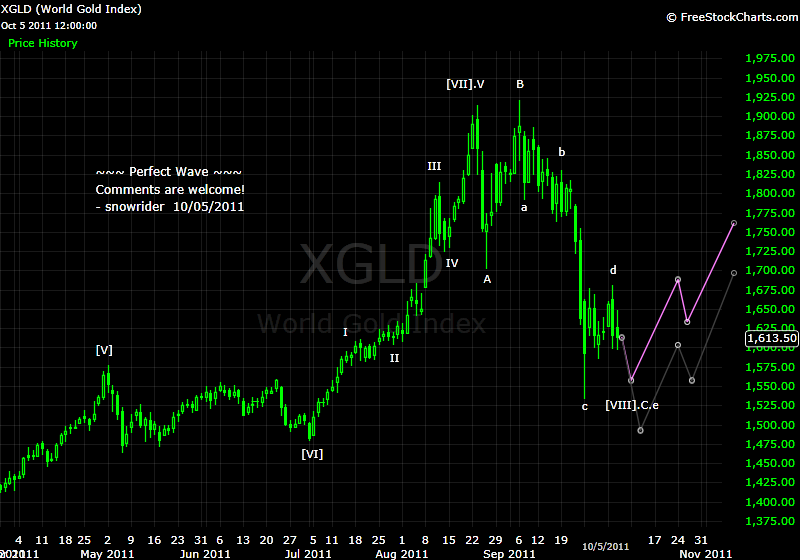
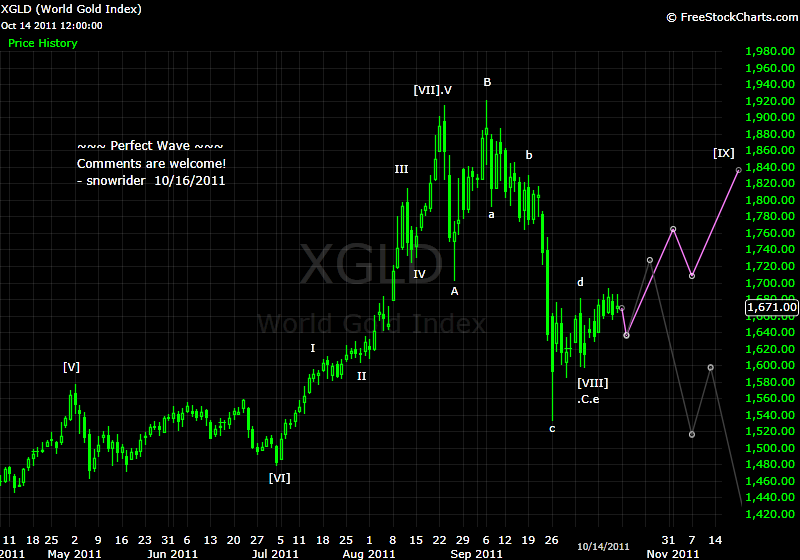
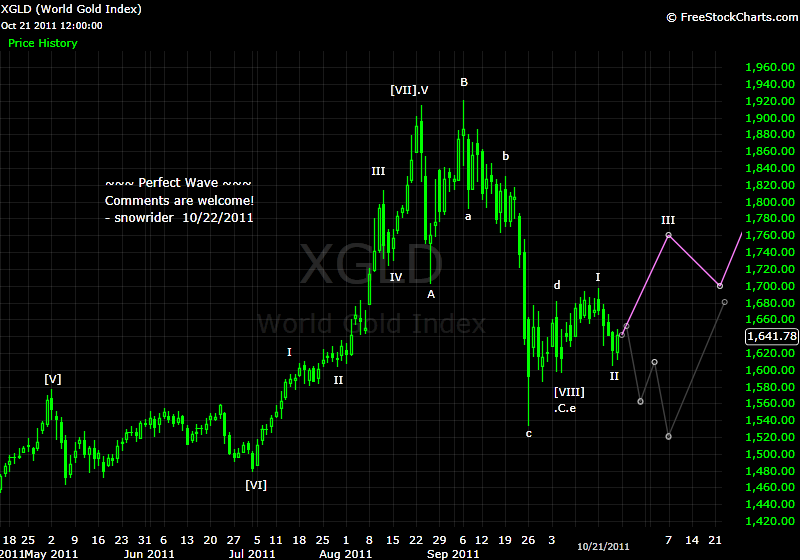
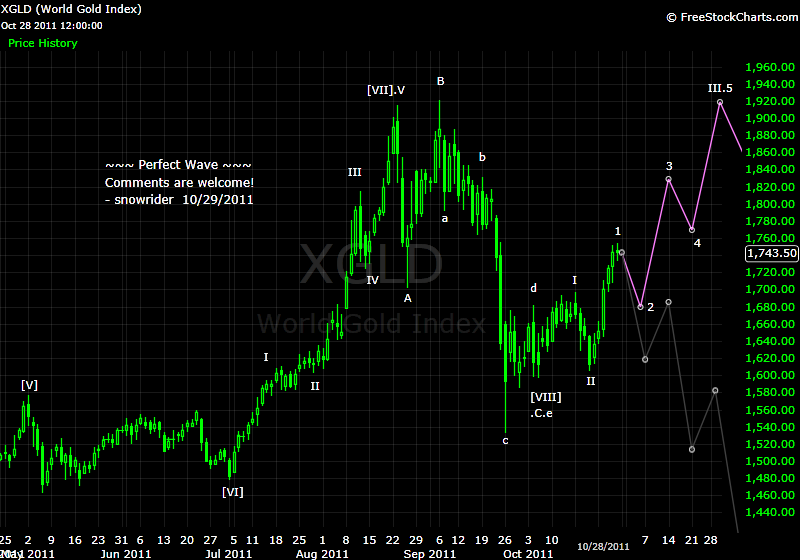
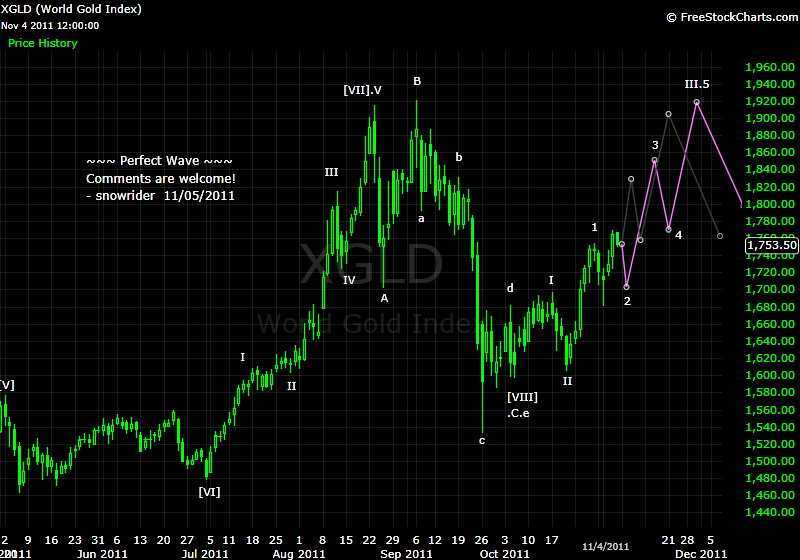
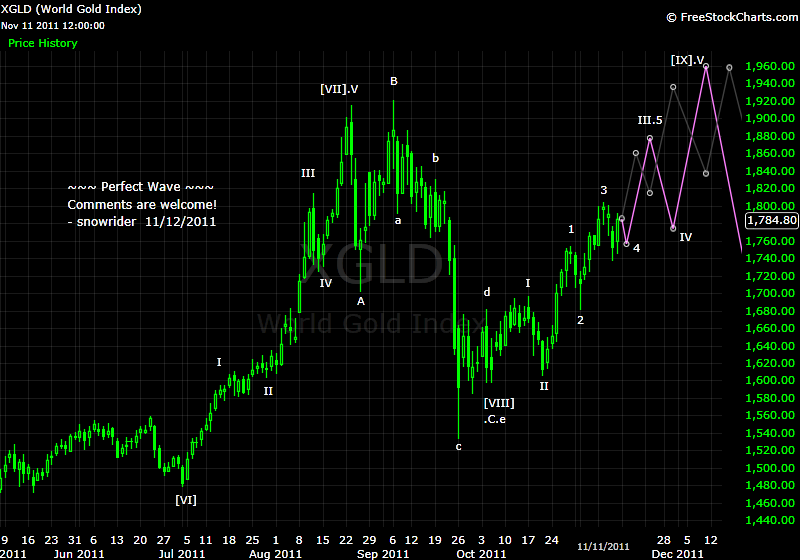
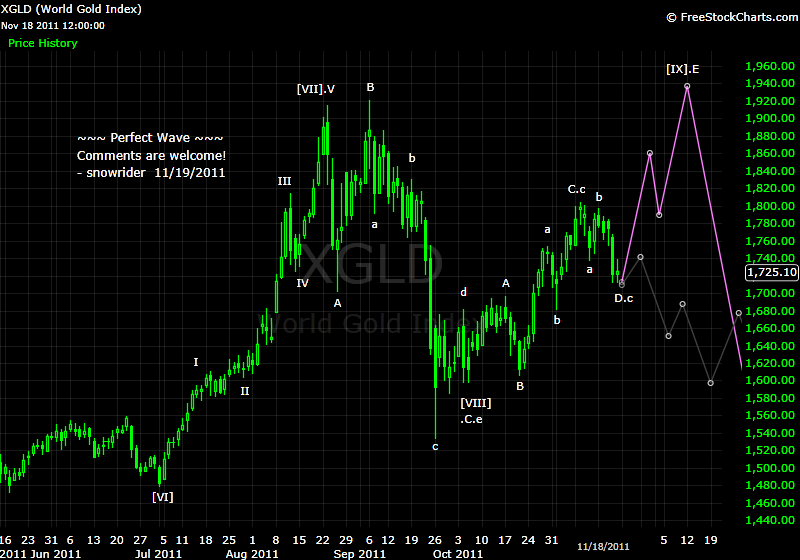
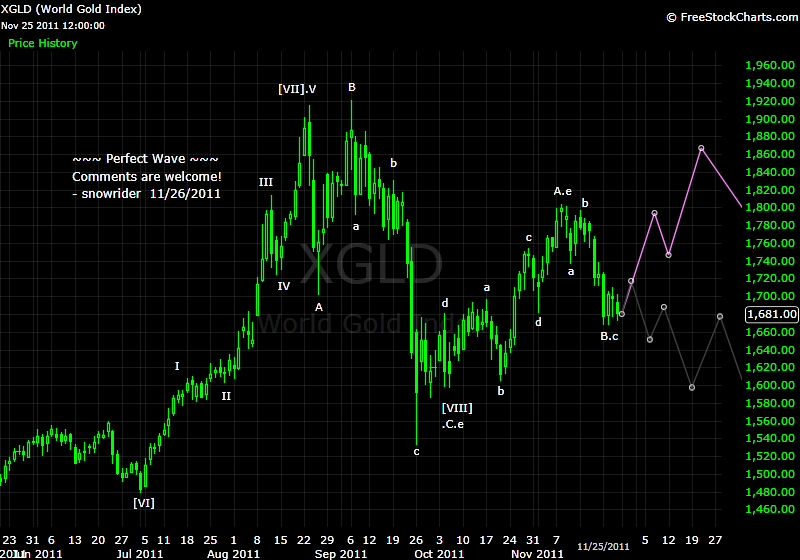
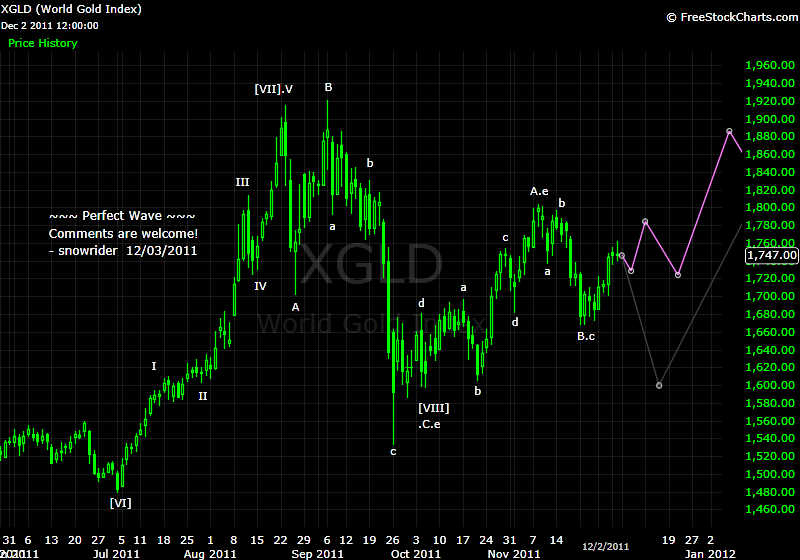
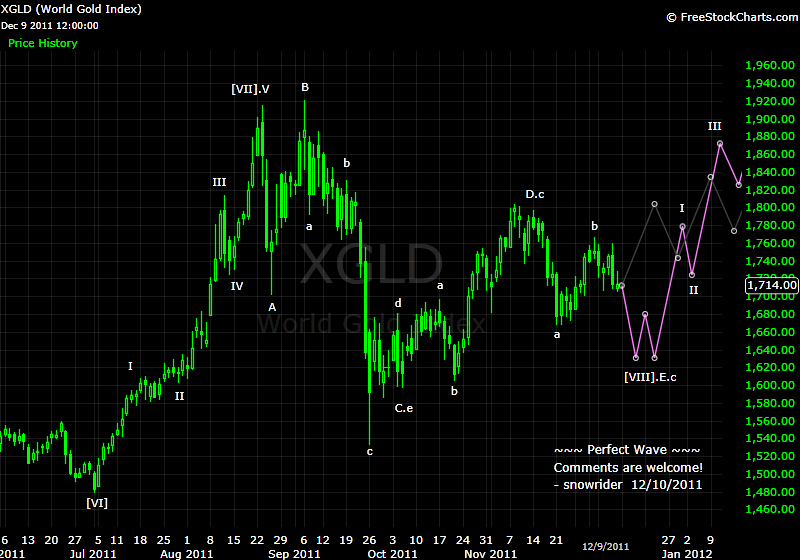
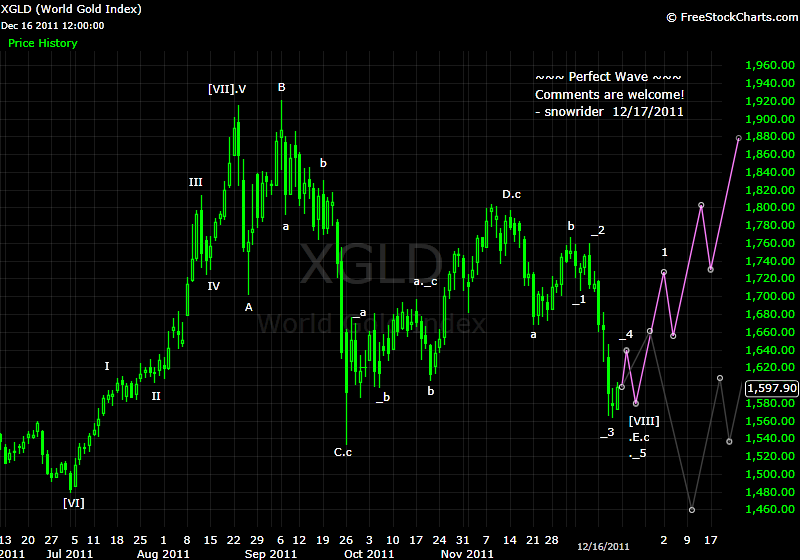
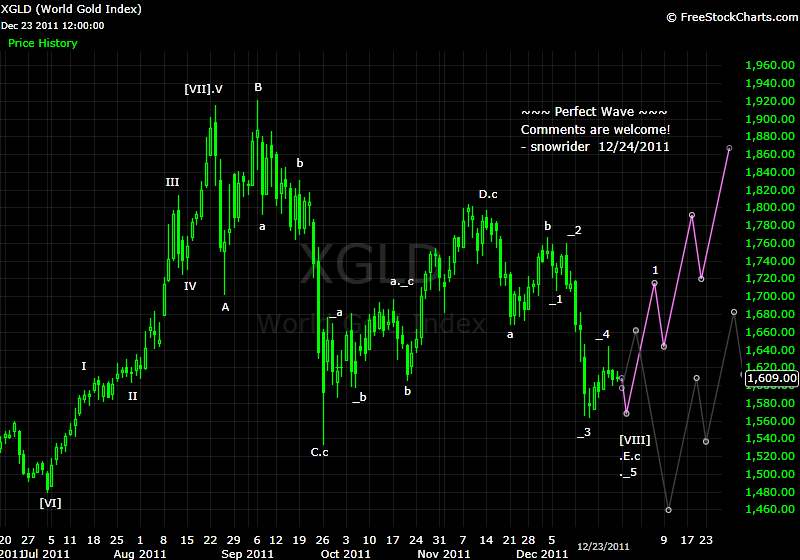
》》黄金之类的是不是比大盘还难分析?
...
最精不见人了?
BigFool 发表于 2011-10-15 23:04
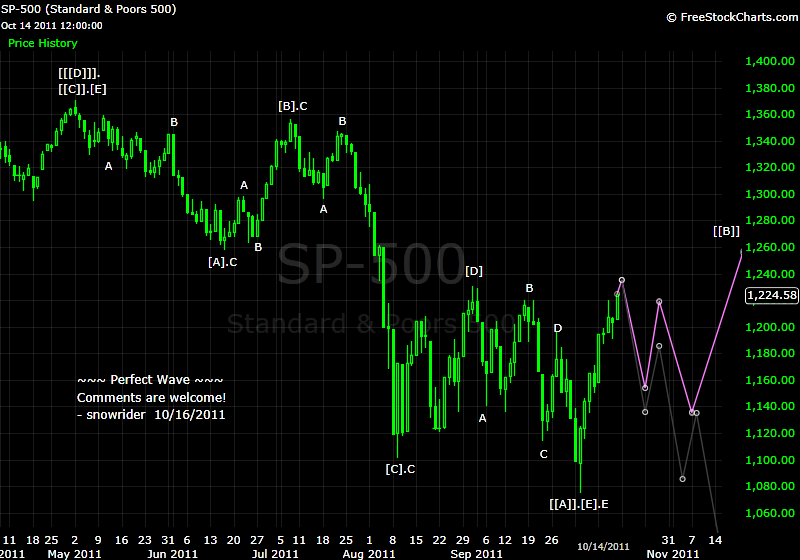

好图,一个合理健康的回调是必须的。
棋王 发表于 2011-10-16 11:04
Quote from jas_in_hbca:
That wave count down to SP 800 or so is my wave count as well and i expect many other E wavers also. Makes me think from the contrarian side that it won't happen.
Quote from jas_in_hbca:
i haven't seen D & E wave labels before. Should they be some kind of 'X' wave ?
Quote from jas_in_hbca:
I also see the 2009 and 2011 moves as impulsive (1, 2,3,4,5 count) . Can corrective waves take a 5-3-5 structure ? I think they can but been awhile since i've read prechters book. If impusive then the 2011 move could be a wave 1 of a larger 3. that would surprise alot of people.
Anyway just thinking out loud. Nice to see your charts.
people who are in love with elliot wave have a selective seeing problem, when it works out they jump up and down and as in most cases it dont work out they make no mention of it on wall street you have 2 groups, those losing money and in love with EV and those who make big money who like to laugh at EV and other indicators
I spent 2 years there
MHP一下,如果按照这个spx的理解交易,若要先等小wave去1100,甚至short到1100的话,就把这个小牛市完全错过了(说不定还亏)。 请教一下,在这种情况下,wave专家们怎么处理呢?
[quote="snowrider"]
...
...
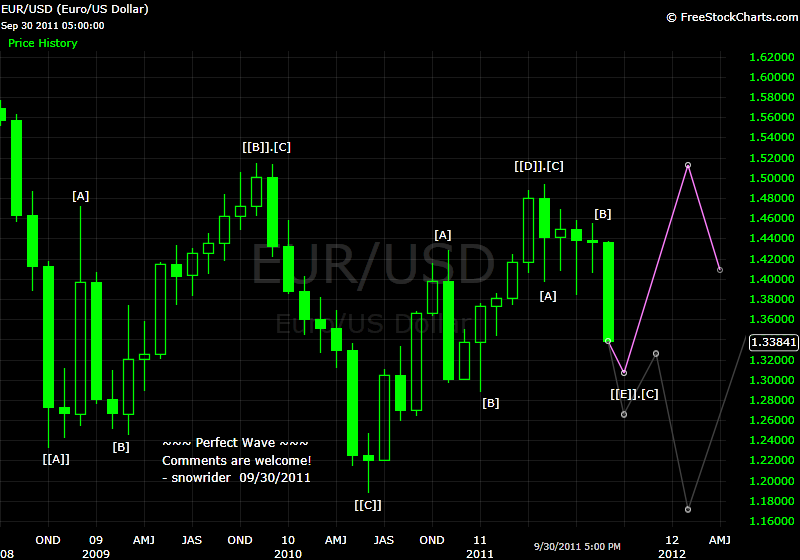
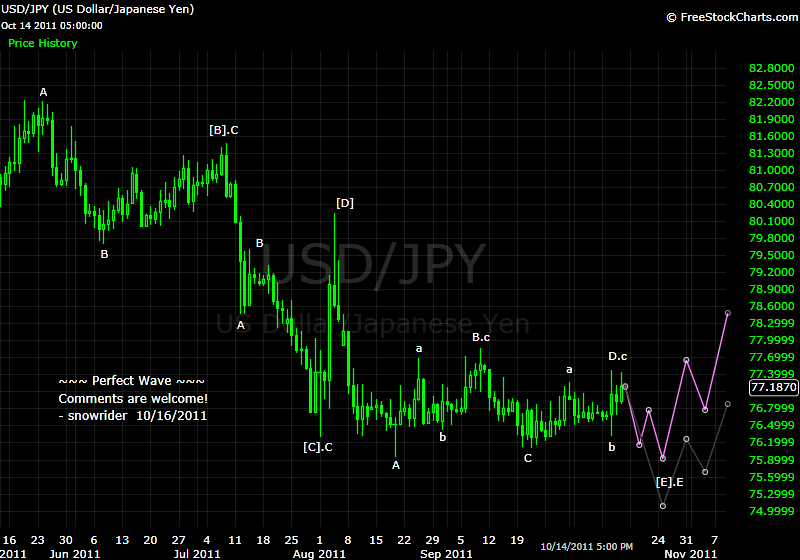
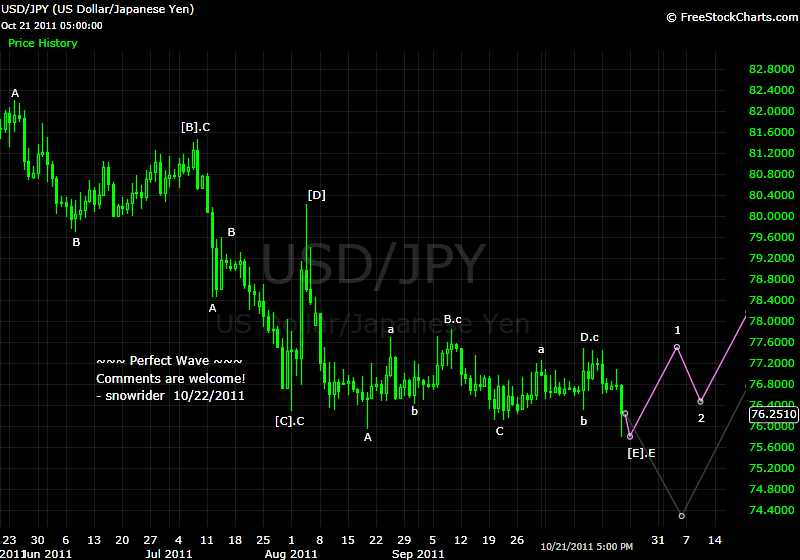
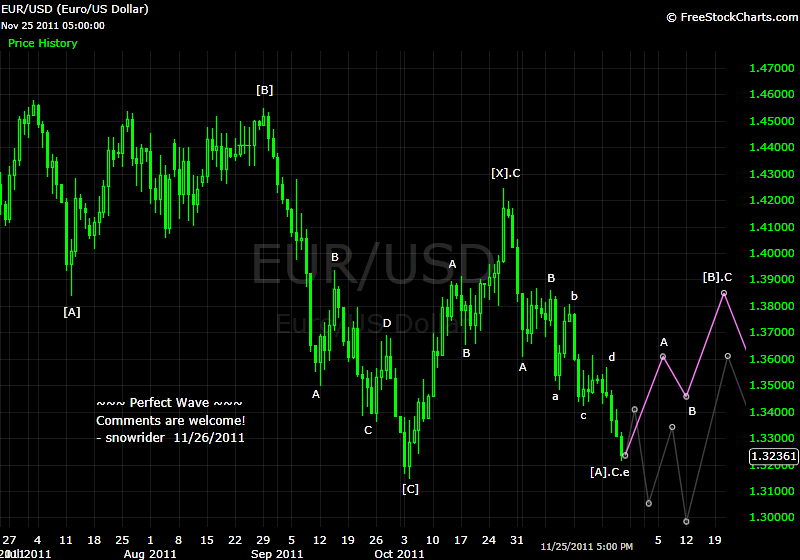
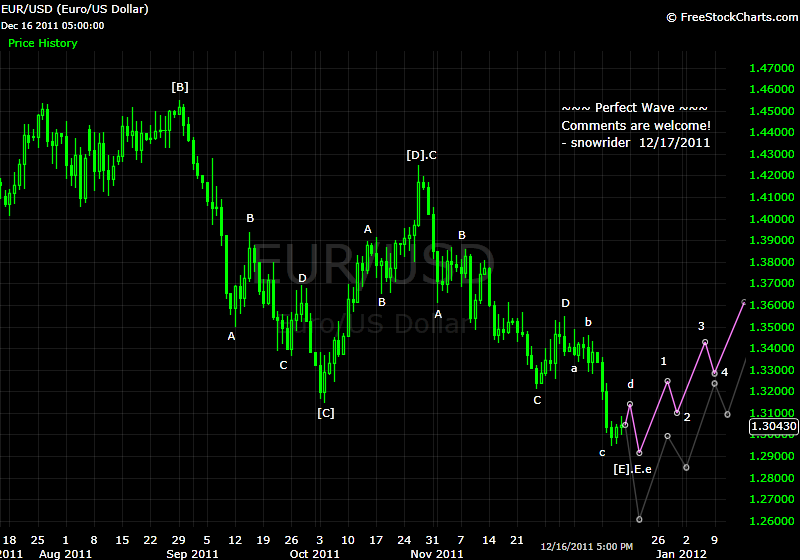
油肉跟SP 是正相关, 这个好像是对的。 两者都面临回调。...
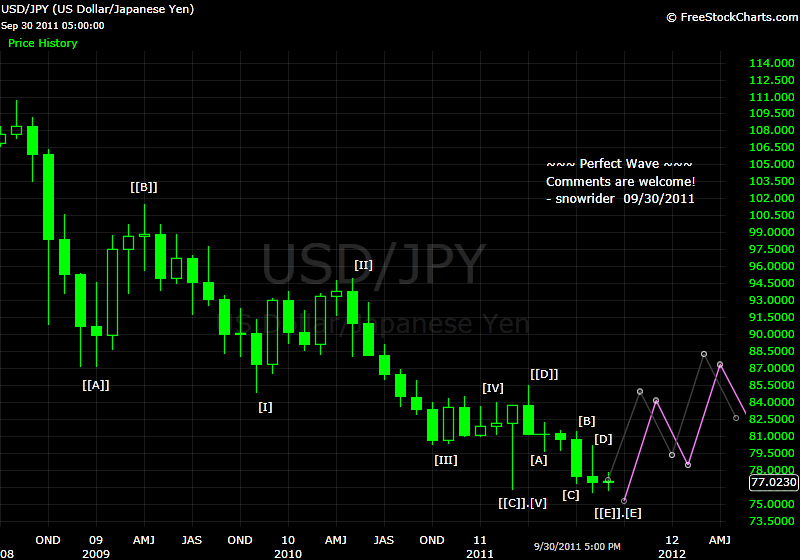
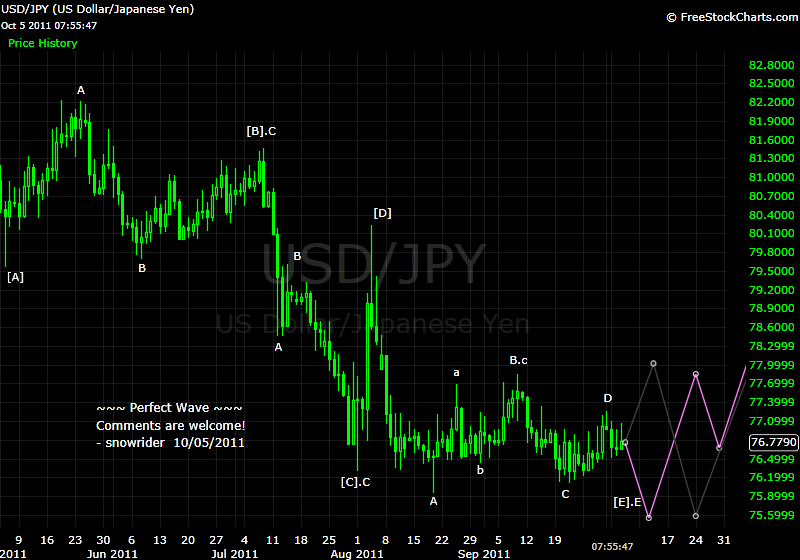
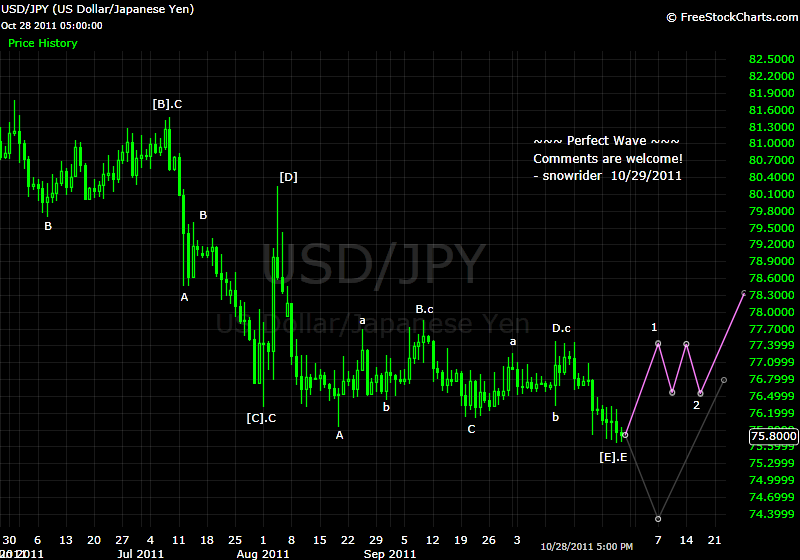
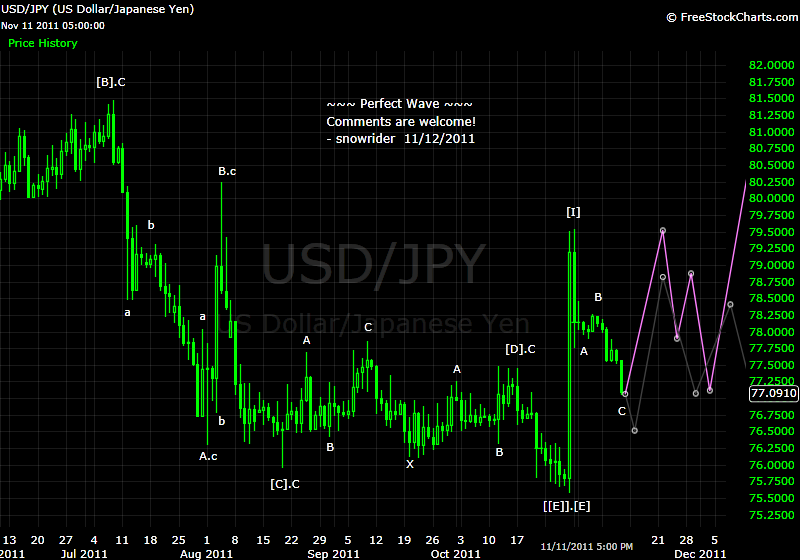
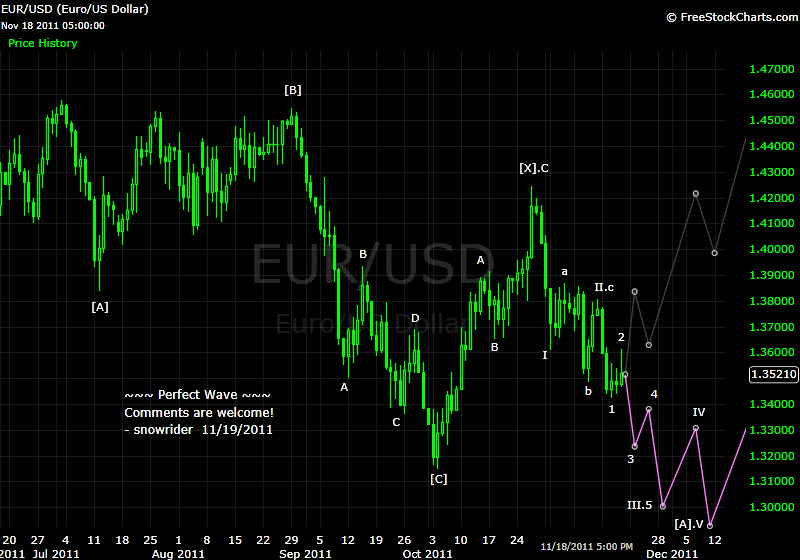
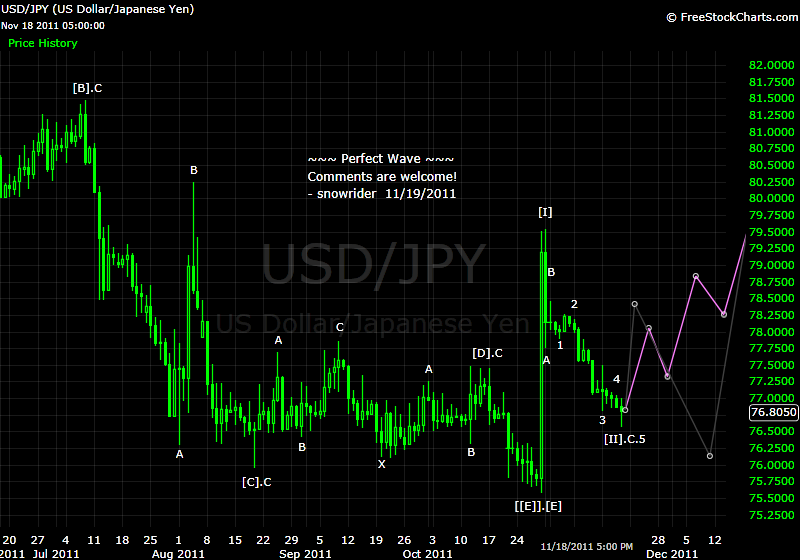
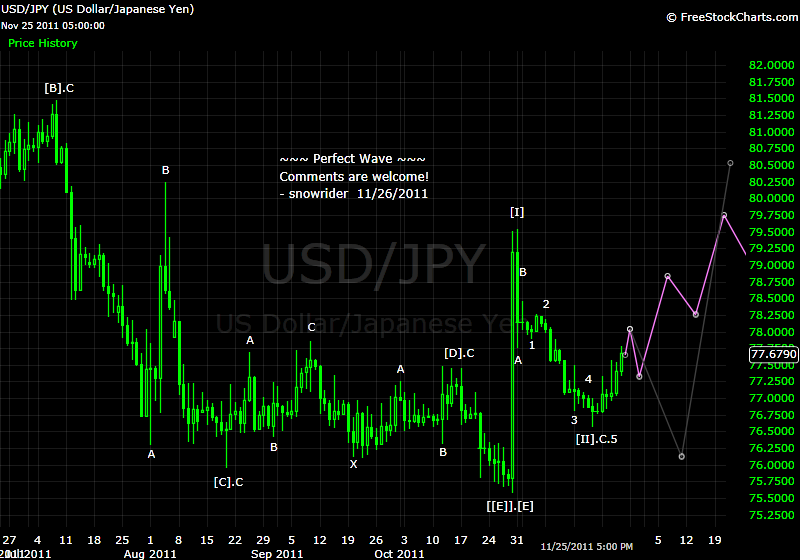
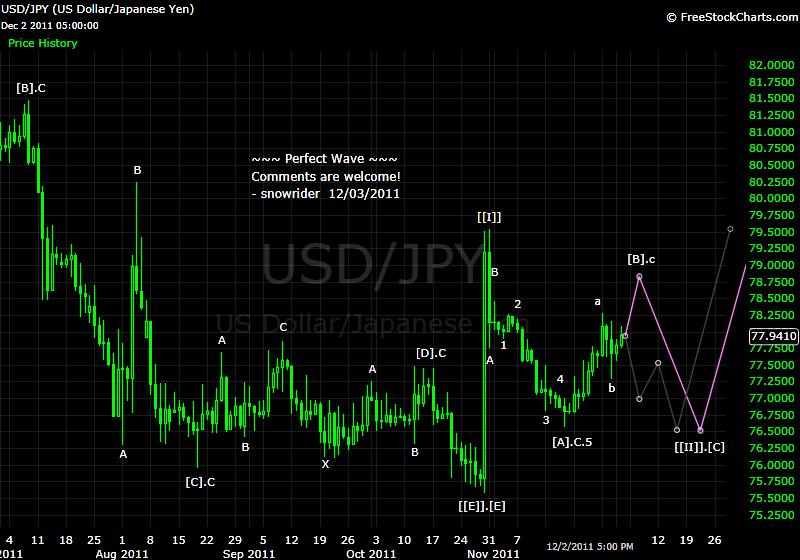
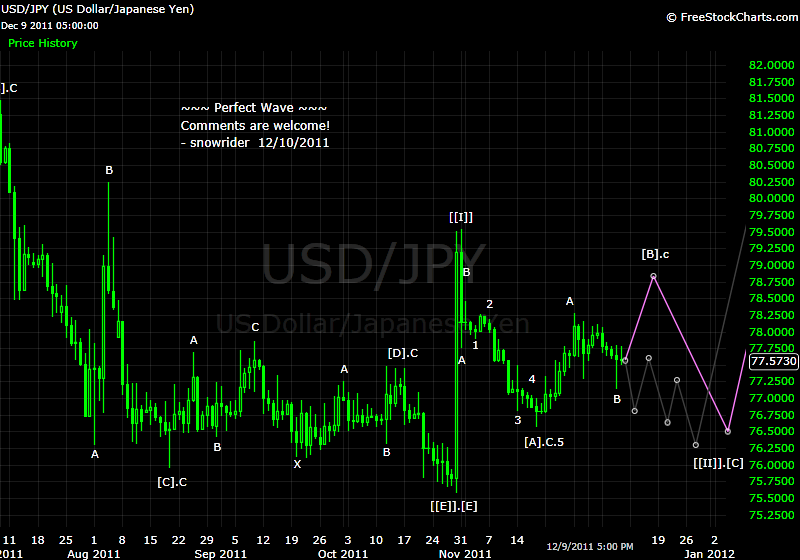
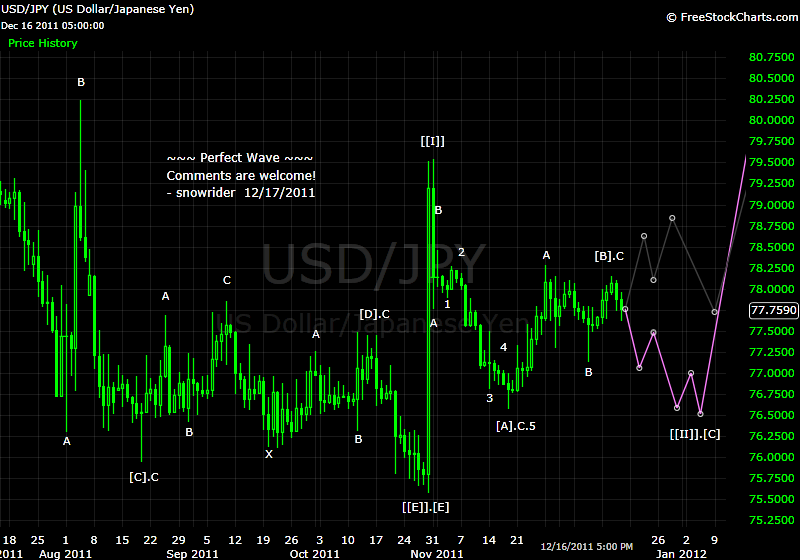
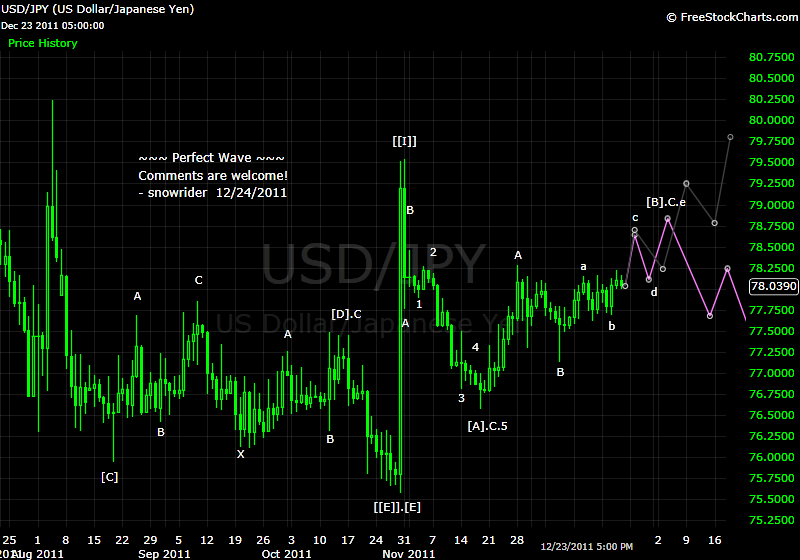
...日元不会再退到 76 以下吧。 我看是就这么上去了。

 图片附件: Chart20111031175139.png (2011-10-31 17:54, 96.37 KB) / 下载次数 19
It's not Elliott Wave?
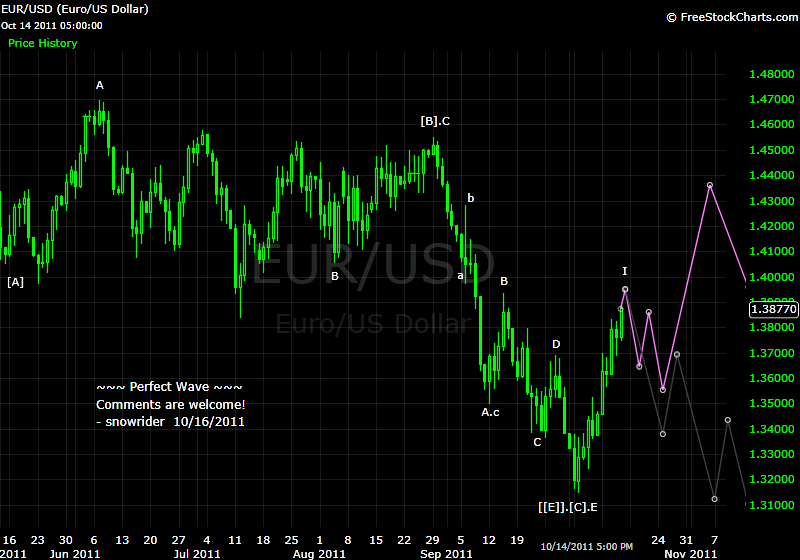
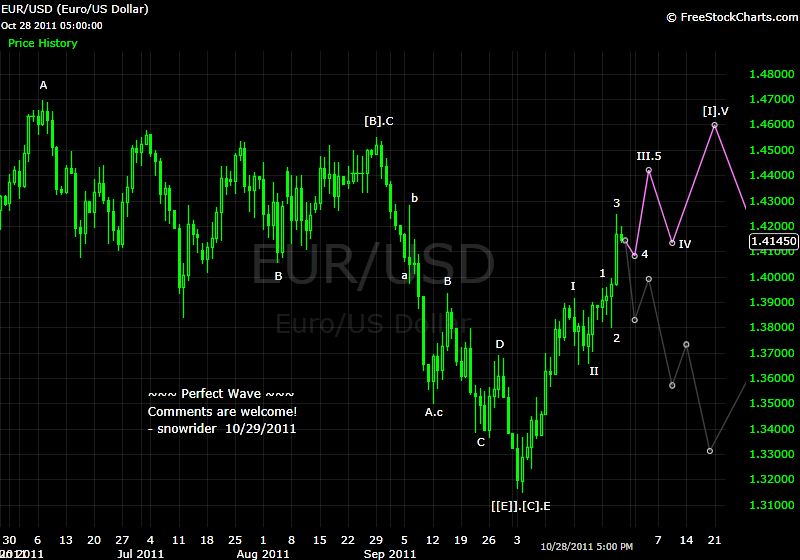
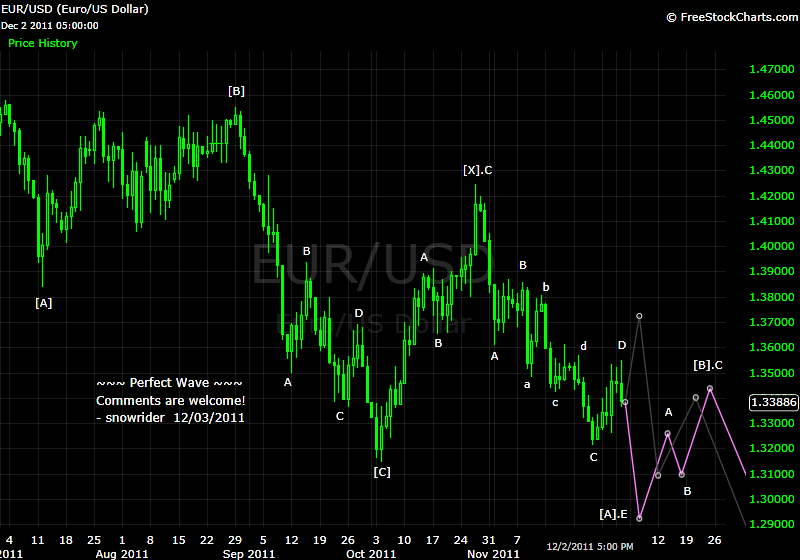
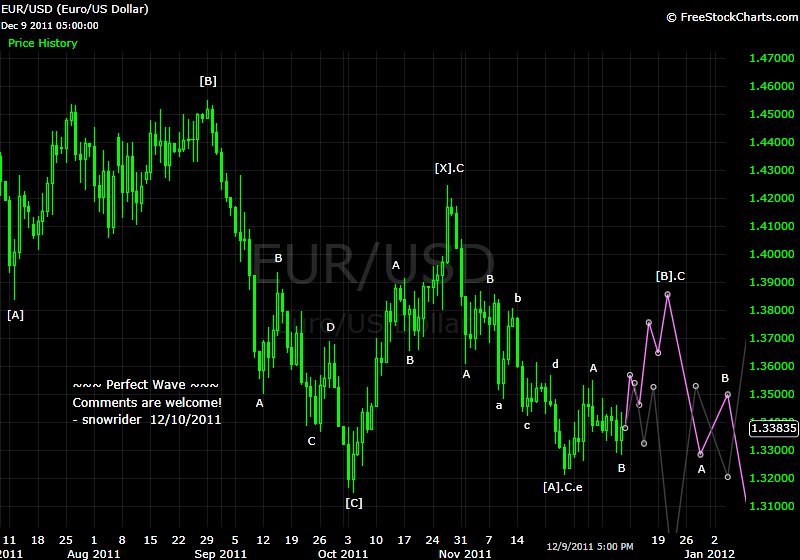
There are two forecast lines, one grey and one purple, which one you will trade on?
...
...
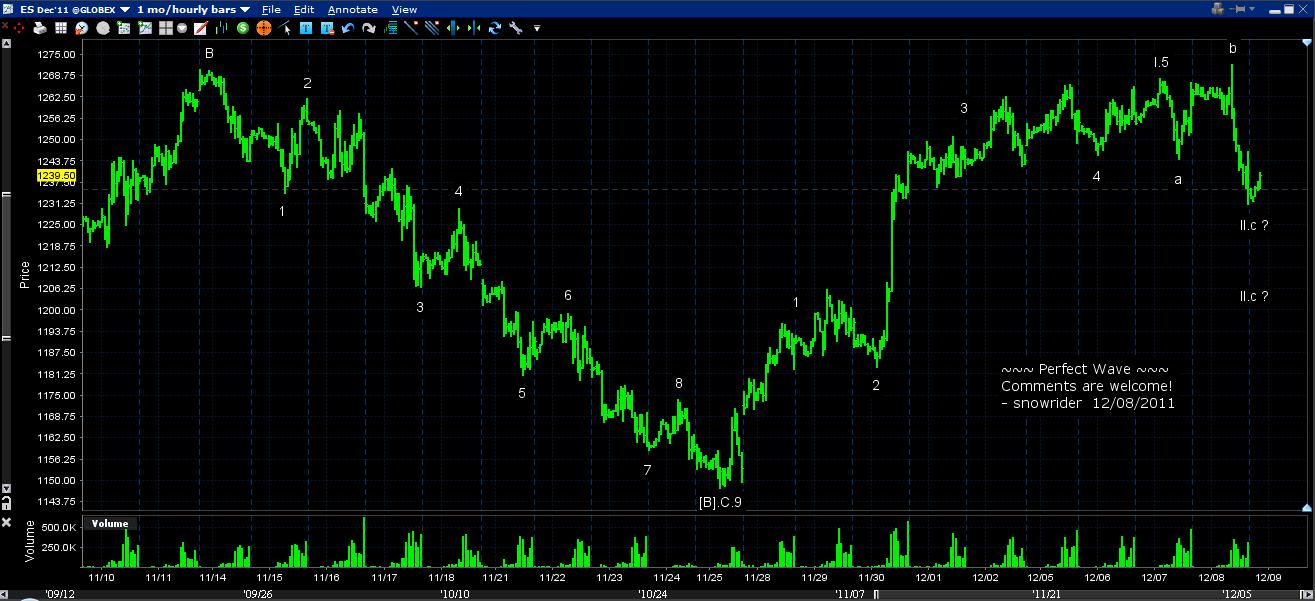
Also, for SPX why you are sure 1285 will be reversal point?
...
...
How did u decided each wave's amplitude? by Fib?
Sorry for so many questions.
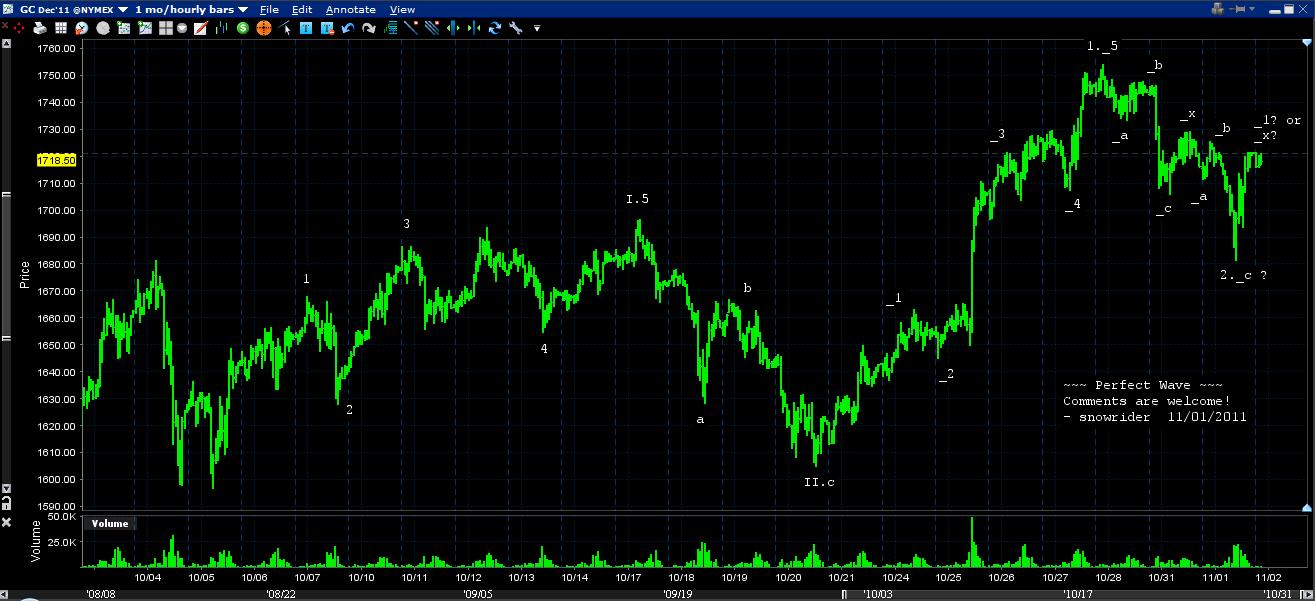
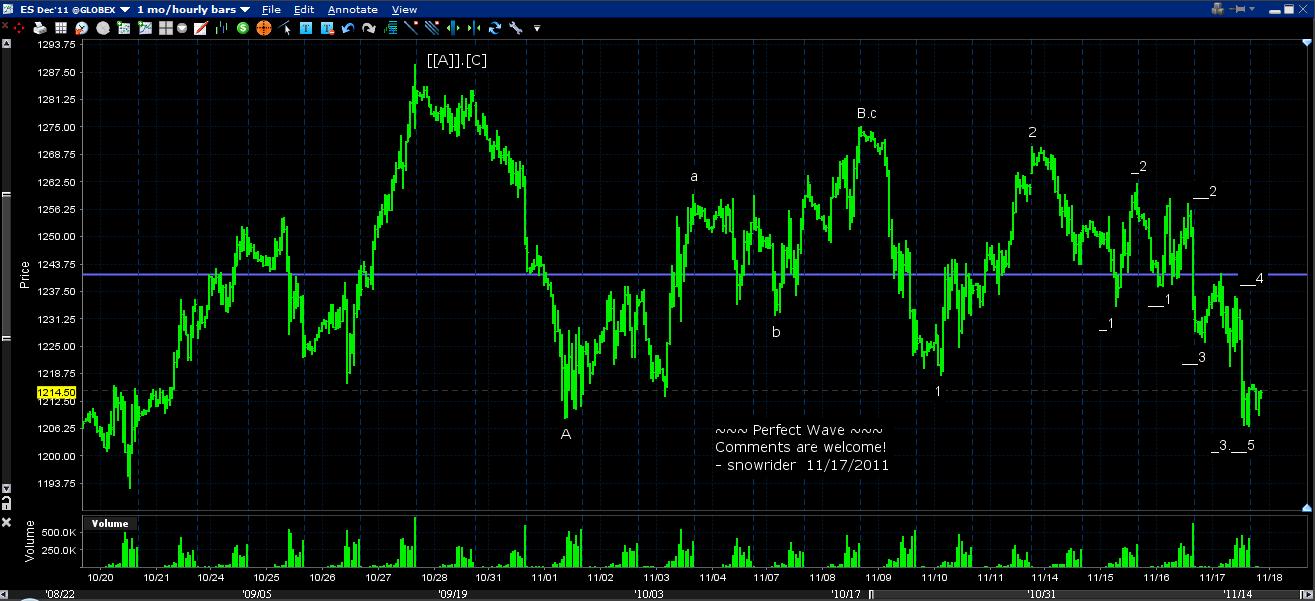
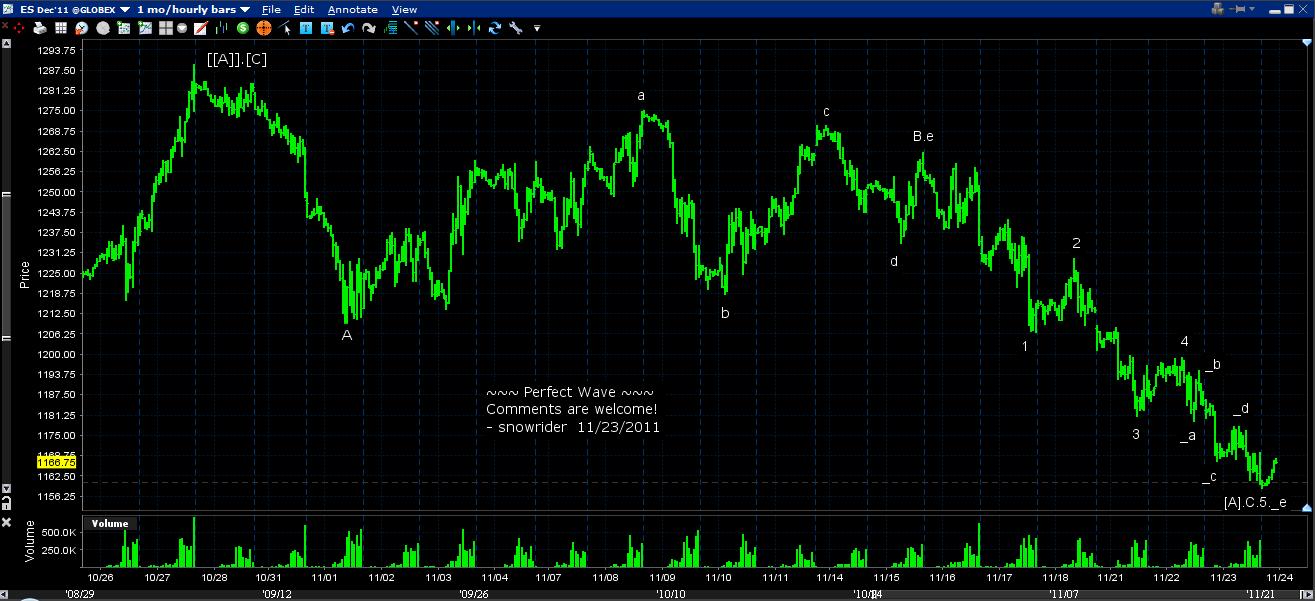
你先来点COMMENTS在图上嘛. 你每周贴的才勉强看明白. 这个intraday图完全看不懂
...
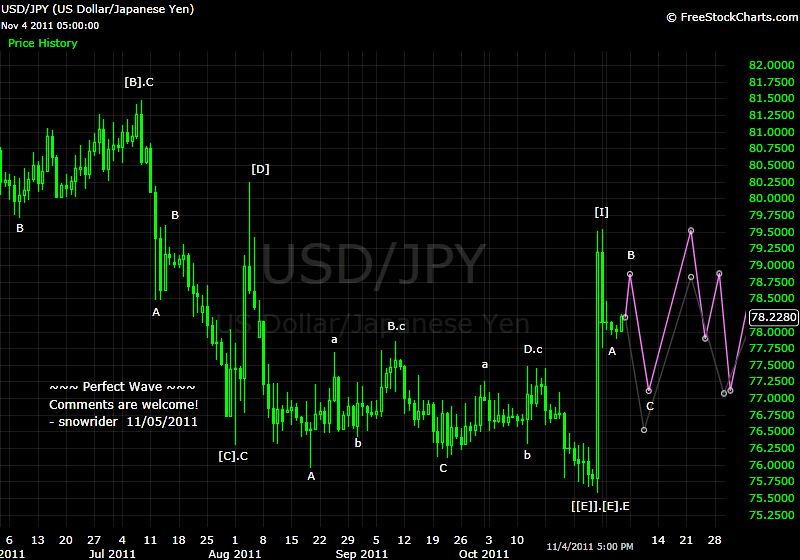
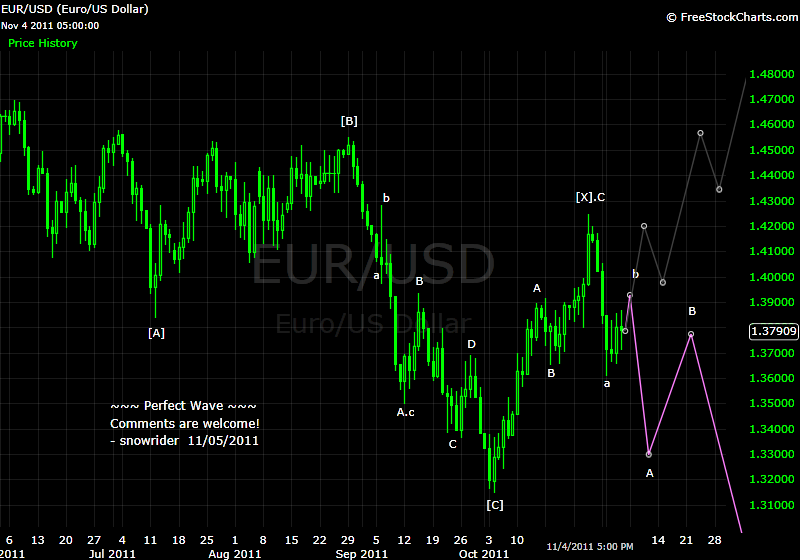
这次的两根线趋势完全相反的呀
谢谢老师的讲解 TA这个WAVE 是不是总得走出来才好去定义是什么波呢?我看电视里也是都讲有可能X波 有可能C波的
...
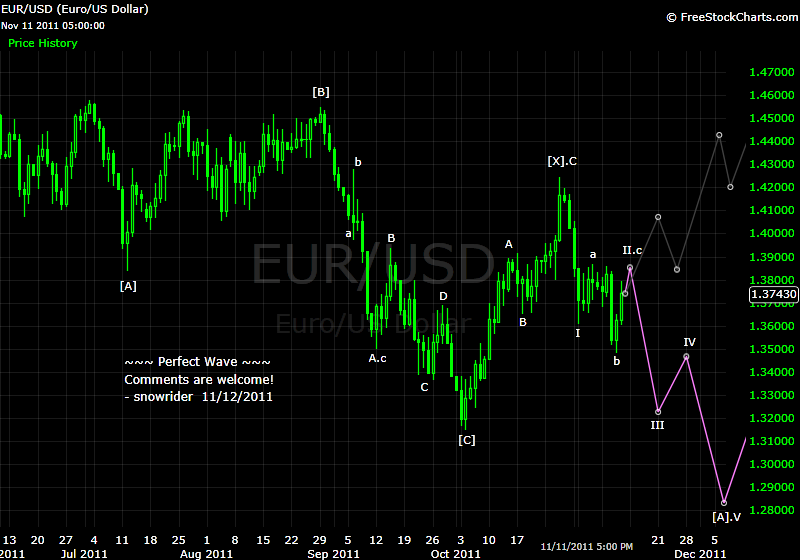
俺从你的图里看到我想要的方向,希望不是mm设的陷阱
要是走那个灰线 估计熊熊就都死了
图上看 日线级别应该有个反弹 对吗? 和...的判断一样
雪骑的EW来判断中,长期走势还是相当的靠铺啊,
棋王 发表于 2011-11-17 23:38
泰迪熊已经见过N次外婆了 555555555
... 11/19/2011,你SP500的wave count是在日线图上的,在最近的[A].C.2的行进中,假设你以紫色线来操作,有没有可能在低级别图中,如30分钟,5分钟图中,其行进方向或pattern并不完全支持日线的紫色线?如果是的话,你会按不同的time frame建仓对冲吗?或者,这次你能同时给个SP500的30分钟和5分钟的wave count 吗? ...
能UPDATE一下吗?
俺想看看。
棋王 发表于 2011-11-23 18:29
能UPDATE一下吗?
俺想看看。
棋王 发表于 2011-11-23 18:29
 ..
..
回复 snowrider
俺就一个问题,走势图所对应的日期,是不是也是算法算出来的,还是一个大概?谢谢
棋王 发表于 2011-11-28 00:50
从你图上看,周一100%下跌啊
上次没有认真领会图的意思 这回泰迪熊被整惨了 5555555555555
不过看这次的图 新高是不可避免啊
等下到10月的低点1070她又会有截然不同的看法了
Quote from iceman1:
...like the pretty purple color with the green; I have found dice work better than elliot wave analysis. ...
Quote from iceman1:
... I am always curious when over the past 25 years I read all kinds of predictions, most of which never occur. Therefore, what exactly are you doing to implement your analysis?! How are you playing it ...
Quote from iceman1:
... is this some academic exercise with nothing really being risked. Anyone can make an educated guess on the market outlook, but few can trade it well.
...
Quote from iceman1:
... After all timing is important, last I checked! Frankly I don't have a fricking clue as to what happens. Anyone who tells me they are sure which way market will move, is a fool or deranged. This market has baffled much smarter people than me and many others. ...
Quote from iceman1:
... Further if you had backed up the truck at least 4-5 times over the past 6 months (maybe more) in some stocks, ETFs and indexes, and nailed it, you could pretty much take the next couple years off and travel the world on a motorcycle. So who cares about wave count?! As I recall from my studies, elliot wave is not a science but subject to very broad interpretation as to count.
Oui?
regards,
Since you post the chart every week, is it ok to have some comments about the last week's prediction, if it is good, and if not, how you adjusted to it, etc. I think that it will be much appreciated. Thanks.
...
看这个图 偶是死定了 5555555555555
Thanks for comments. It is very helpful.
I just feel that Thursday's correction is too shallow. It is still possible that we have two legs down. So we may revisit Thursday's low or even go to 1220. I'm wondering why you think that we should go up from here.
...
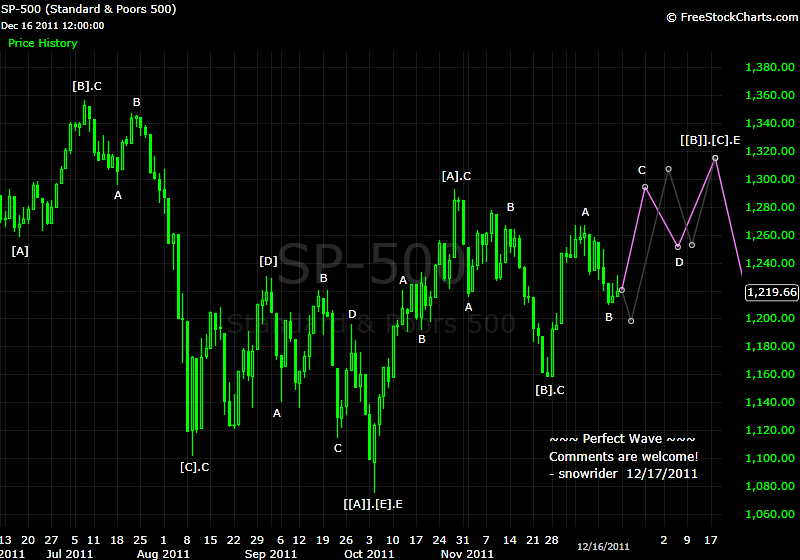
So the basic impression is: we will find a bottom soon (it may have been there, or a little lower than last week's low), and go up to pass the MA 200.
Just wonder why you ignore the possibility to break down from the current big triangle (breaking 1200).
...
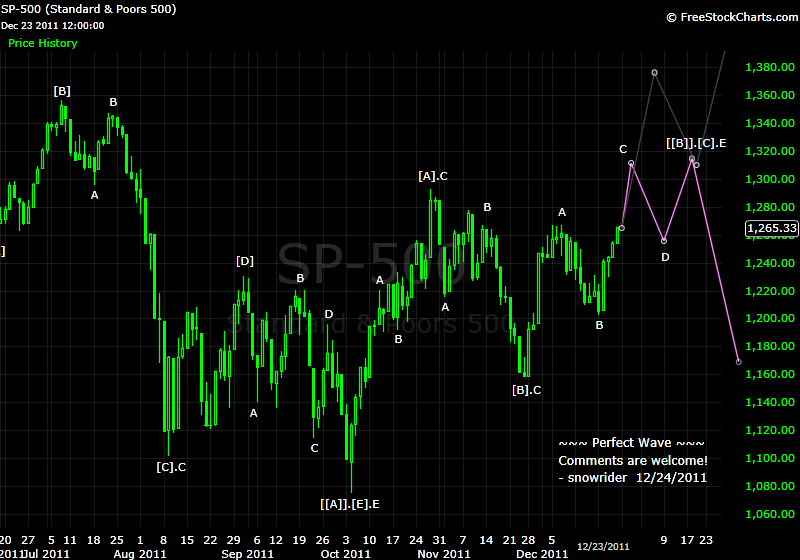
1300 a must???
not4weak 发表于 2011-12-25 18:57
Quote from ammo:
snow would you do this monthly ,i havent attempted to learn ew,but if this were wave 5,whats the longer /shorter than prev wave rule,or measured move,thanks and merry xmas
為何有時 abcde 有時 12345?
| 欢迎光临 华人论坛 (http://yayabay.com/forum/) | Powered by Discuz! 7.2 |

